Assessment
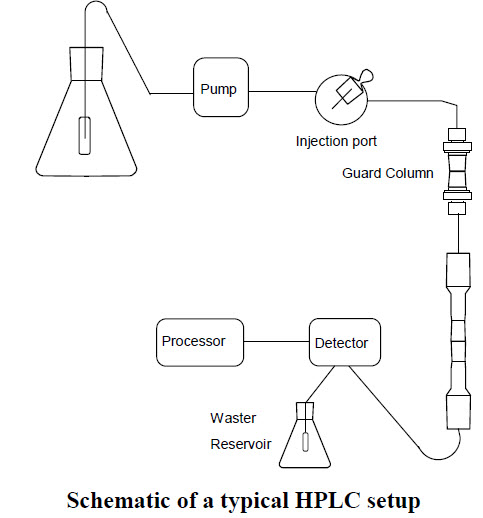
HPLC is a common analytical technique that is used for many applications including separation, identification, purification, and quantification of various chemical species. It is used in research in the fields of chemistry, biochemistry, biology, toxicology, cosmetics, and pharmaceuticals. The method involves separating molecules dissolved in a solvent that is in motion (mobile phase) at high pressure over a solid support material. This leads to the separation of individual chemical species based on their binding affinities to the solid matrix versus their solubility in the mobile phase. A diagram of the key components of an HPLC system is shown below. 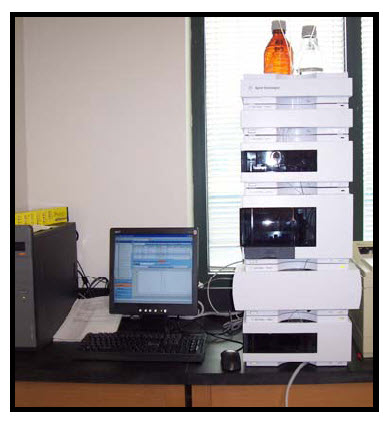
 Further dilute the ascorbate stock with the acetic acid buffer to obtain 10 ml of working standards at 200, 100, 50 and 25 µM. Place 1 ml of each solution in an HPLC vial, making sure to label appropriately with sample name, concentration, group name, and date. Calibration standards must be prepared on the day of HPLC analysis. Make a 50% (v/v) juice solution with acetic acid buffer and mix thoroughly. (You will need to calculate the amount of apple juice needed to make all of your dilutions.)Centrifuge this dilution for five minutes and decant the supernatant. If the supernatant is clear, filter the juice with a 0.45 µm syringe filter to remove fine particles. To do this, pull the solution into a syringe, then put the filter on the tip, and push the solutions through the filter into a clean container. Throw away both the filter and the syringe after use. Continue diluting the filtered apple juice with acetic acid buffer to final concentrations of 10%, 2%, & 1% by volume, making 10 ml of each solution. Place 1 ml of each solution in an HPLC vial as before. Deliver your HPLC vials to the HPLC instrument. The samples will be loaded into an autosampler and sequentially injected onto the HPLC column. The output from the column is monitored with a UV or electrochemical detector. The signal from this detector is processed with a computer program and provides several pieces of information. First, a chromatogram, which is a graph of the output from the detector over time, is printed. A chromatogram for each sample will be printed and provided to you.Second the computer is programmed to integrate the area of each peak on the chromatogram. Using the HPLC protocol described in this module, ascorbate separates from other components in the sample and elutes as a single peak with a retention time of 4.1 min. Retention time is the elapsed time from injection until the maximum height for a single peak passing through the detector.
Learning Context/ Introduction
In this research activity students will prepare juice samples for ascorbate concentration determination by titration or HPLC. For either method they will prepare a stock solution and dilutions of ascorbate for use in generating a standard curve. They will then treat and dilute samples of orange and apple juices so that they are suitable for injection into the HPLC or use in the titration method. For the ascorbate analysis by HPLC the standard and test samples will be sent to the instrumentation lab for injection and the results returned to students for later analysis.
Duration
Construct a standard curve for ascorbate by plotting the concentration versus volume of indophenol titration solution used to reach the end point of the titration. Determine the concentration for samples using the best fit straight line for the standards as described above. Compare your results to those of other students in your classroom. What errors could have been made in the titration that may have caused a difference in results? Compare your results to that listed on the back of the juice container. If there were differences between your results and the juice, why do you think this occurred? What would you do differently?
Essential Question
To determine the ascorbate concentration in apple and/or orange juice.
Essential Question
Ascorbate (more commonly referred to as vitamin C) is an essential nutrient that is found in a variety of plant foods. A lack of sufficient amounts of this nutrient in the diet is responsible for the disease known as “scurvy.” This disease is characterized by spongy and bleeding gums, bleeding under the skin, and extreme weakness due to anemia. Sir James Lind established the link between scurvy and an essential component of plant foods in the 1700s. Lind’s experiments determined that limes contained a substance that would prevent the scurvy, so British sailors began consuming limes during long voyages and acquired the nickname “limeys.” This important substance is ascorbate. Most animal species can synthesize ascorbate. However, humans, guinea pigs, fish and fruit bats require dietary sources of the nutrient. In the human body ascorbate serves two main functions. It serves as a cofactor for reactions that lead to the maturation of collagen, and vitamin C is the primary antioxidant in the body. Vitamin C is the most common of the single-nutrient supplements and it is often added to many prepared foods to prevent oxidation, or spoiling. In living systems that utilize ascorbate as an antioxidant, enzymatic reactions catalyze the reduction of dehydroascorbate back to ascorbate, using reducing equivalents supplied by glucose oxidation. This allows the vitamin to be reused multiple times - a common characteristic of essential nutrients. Since ascorbate is the most abundant nutrient antioxidant in fruits and vegetables, you will determine its concentration in samples that you commonly encounter as a basis for comparison in this experiment. The ascorbate present contributes to the overall TEAC activity of a particular food or substance. But with other antioxidants present, how do you determine just ascorbate?Two methods are offered to quantify vitamin C content in foods. The first method is titration. The titrant is a dye compound that is reduced by vitamin C to a colorless liquid. The second method involves separation and quantification by high-pressure liquid chromatography (HPLC). Both methods require extraction of ascorbate from the food matrix, followed by analysis. The instructor will determine which method is used.
Instructional/Environment Modifications
Laboratory 1: Making Solutions and Determining the Best Wavelength of Absorbance for the Copper (I) Neocuproine Complex ProductLaboratory 3: Determination of Ascorbate (Vitamin C) Concentration in Common JuicesLaboratory 4: Independent Research Project
Procedure
Make a 20 ml of a stock solution of 1.0 mM ascorbate in dilute (5% v/v) acetic acid. This ascorbate solution will serve as the stock concentration for either the HPLC method or the titration method.
Reflections and Feedback
Analysis of HPLC data:Compare the chromatogram of your samples with that of the standards to determine the concentrations of ascorbate in your samples. Record your visual observations in your notebook. At what time does the peak for ascorbate elute? How do you know that this is the ascorbate peak? See Appendix B for an explanation on how to read the chromatogram.Make a plot for your standards of peak height versus concentration. Calculate a line equation for this plot. Substitute the peak height for your samples into the “y” of the line equation and solve for “x.” This is the concentration of your sample. Do this for all dilutions. Questions: Why did you need to separate the components of the sample before measuring their absorbance?
Student Work
ascorbic acid - Sigma 5% acetic acid with 0.35 mM tris(2-carboxyethyl)phosphine hydrochloride (TCEP) – both from Sigma 7% (w/v) sodium carbonate solution – previously prepared$0 $0HPLC autosampler vials (for HPLC analysis only)range juice – grocery store Apple juice – grocery store 2,6-dichloroindophenol – Sigma (for ascorbate titration analysis only)Sodium bicarbonate – Baker Chemical Co. or similar (for ascorbate titration analysis only)Titration glassware (for ascorbate titration analysis only)Antioxidants Student Manual (PDF)
Related Resource
This method is based on the ability of ascorbic acid to reduce the oxidation-reduction dye indicator 2,6-dichloroindophenol to a rose-colored solution.Dilute the 1mM ascorbate stock solution in 5% acetic acid to obtain 10 ml of working standards of 500 µM and 200 µM. These three concentrations (1 mM, 500 µM, and 200 µM) will make up your calibration curve. Prepare one trial of each concentration to be used in the calibration curve. Filter or centrifuge (if available) 100 mL of juice until the filtrate or supernatant is clear. Dilute the filtrate to 50% (v/v) using 5% acetic acid. If you centrifuged the juice, decant the supernatant and dilute the supernatant to 50% (v/v) with acetic acid buffer and mix thoroughly. If a precipitate forms, remove it by either centrifugation or filtration.$0 $0 $0 $0Make dilutions of the resulting clear supernatant with acetic acid buffer to final concentrations of 50%, 20%, & 10% by volume. The total volume for each dilution should be 10 ml.If the 2,6-dichloroindophenol solution has not been prepared for you, you must prepare it: Dissolve 50 mg 2,6-dichloroindophenol sodium salt (Sigma) in 50 ml water to which has been added 42 mg NaHCO3. Mix thoroughly and, when the salt is dissolved, dilute to 1000 ml with deionized water. Filter and store in a capped glass bottle protected from light.Place 2 ml of standard ascorbate solution into a 50 ml Erlenmeyer flask containing 5 ml of acetic acid buffer. Fill a 50 ml buret with indophenol solution. Remove the funnel. Record the starting volume of indophenol in the buret. Add indophenol slowly to the juice solution until the solution turns to a light rose color.Record the final volume of indophenol in the buret. Calculate the amount of indophenol used. Repeat for all solutions. Indicate your findings in your notebook

