Learning Context/ Introduction
This experience will go over the reading of both bar and line graphs. As a final project, the students will create their own bar and line candy graphs.
Essential Question
How do you tell the difference between a bar graph and a line graph?
Duration
Three 80 minute block classes
Procedure
Day 1
1) Explore bar graphs on www.nces.ed.gov/nceskids/createAgraph
We will explore the process of collecting data to make the graphs. Then we will look at what information we have and how to label the title of the graphs and the x and y axis. Students can then work in cooperative groups and create their own graphs on the computer. They can collect data on various attributes such as eye color, height, hair color, etc.
2) Explain the 3 labels of the graph on the web site: Title, x-axis, y-axis.
3) Practice reading bar graphs from RCT Mathematics.
Day 2
1) Explore line graphs on www.nces.ed.gov/nceskids/createAgraph
2) Explain the 3 labels of the graph on the web site: Title, x-axis, y-axis.
3) Practice reading line graphs from RCT Mathematics.
Day 3
1) Review the two types of graphs; line graphs and bar graphs.
2) Go over the first step of creating both types of graphs is to make a data table and collect the information.
3) Each student will be given a package of fun pack M&Ms and collect data on the colors of the M&Ms.
4) Each student will then be asked to create a bar and line graph using candy representation. Students will use licorice cut to size for the bars (licorice bites work great for 1/2 inch graph paper) for bar graphs, and dots and licorice strings or pretzel sticks to form line graphs.
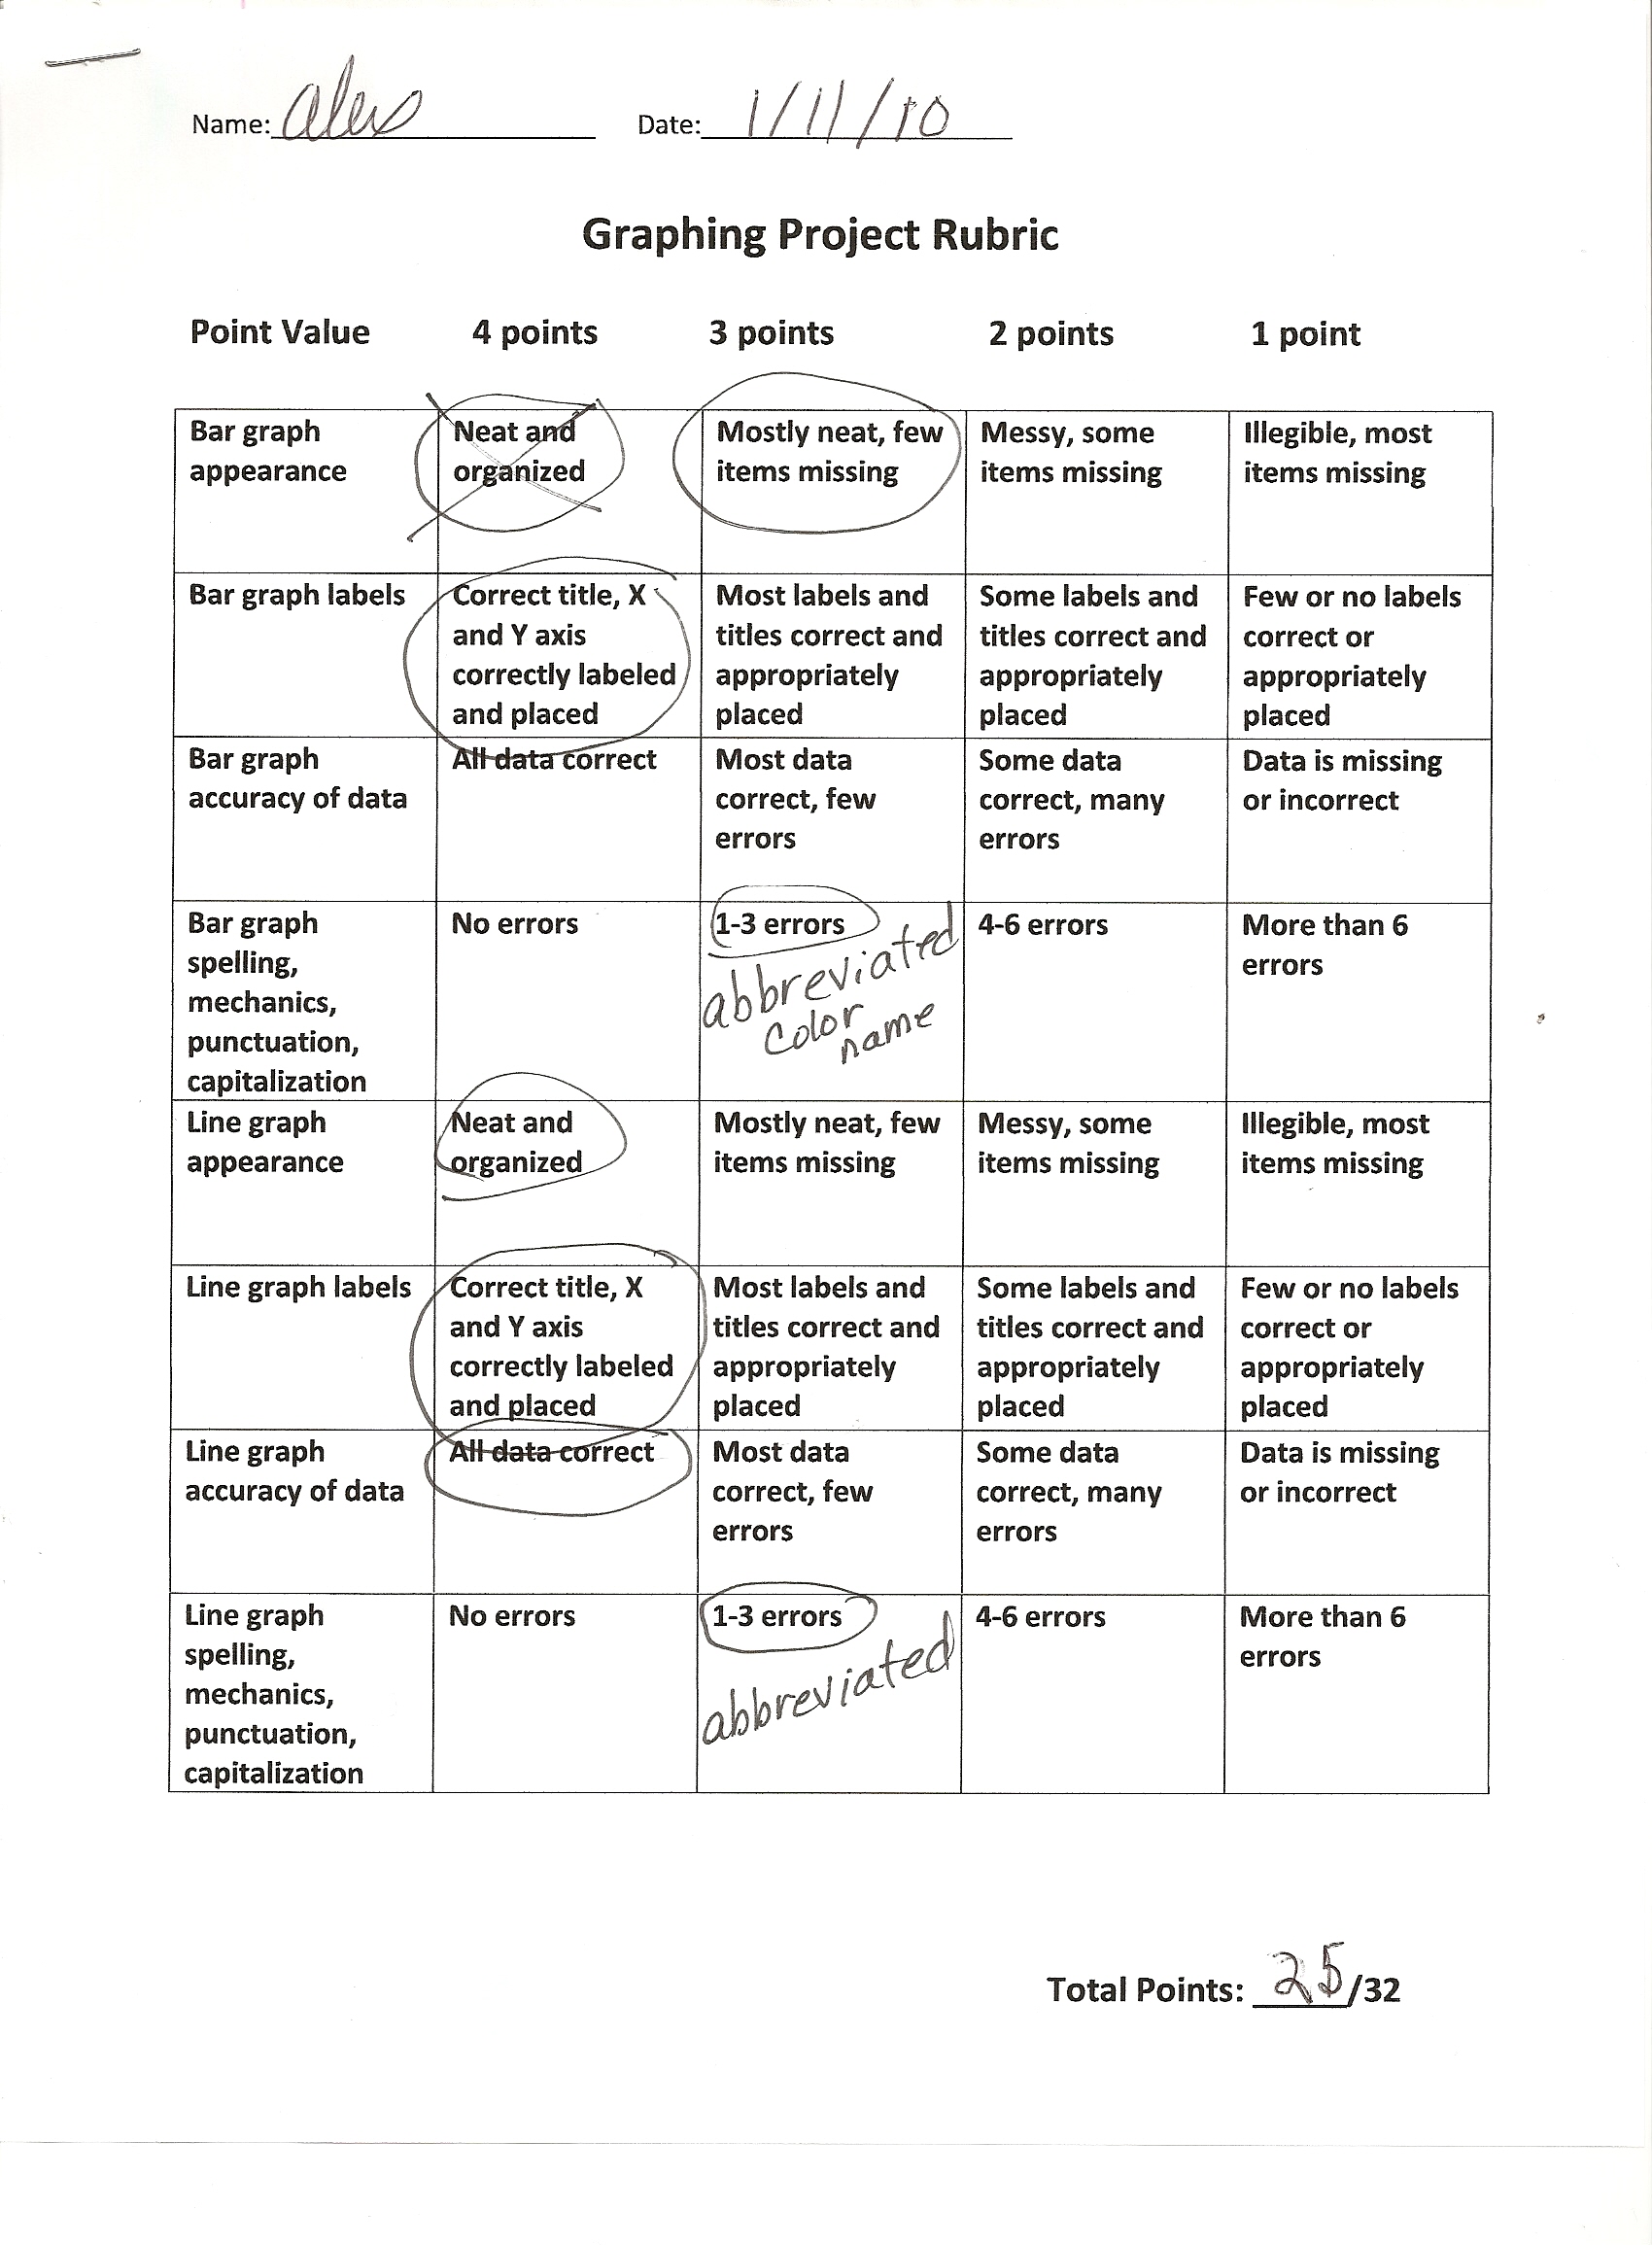
Assessment
Rubric
Graph Project
Graphing Project Rubric.doc

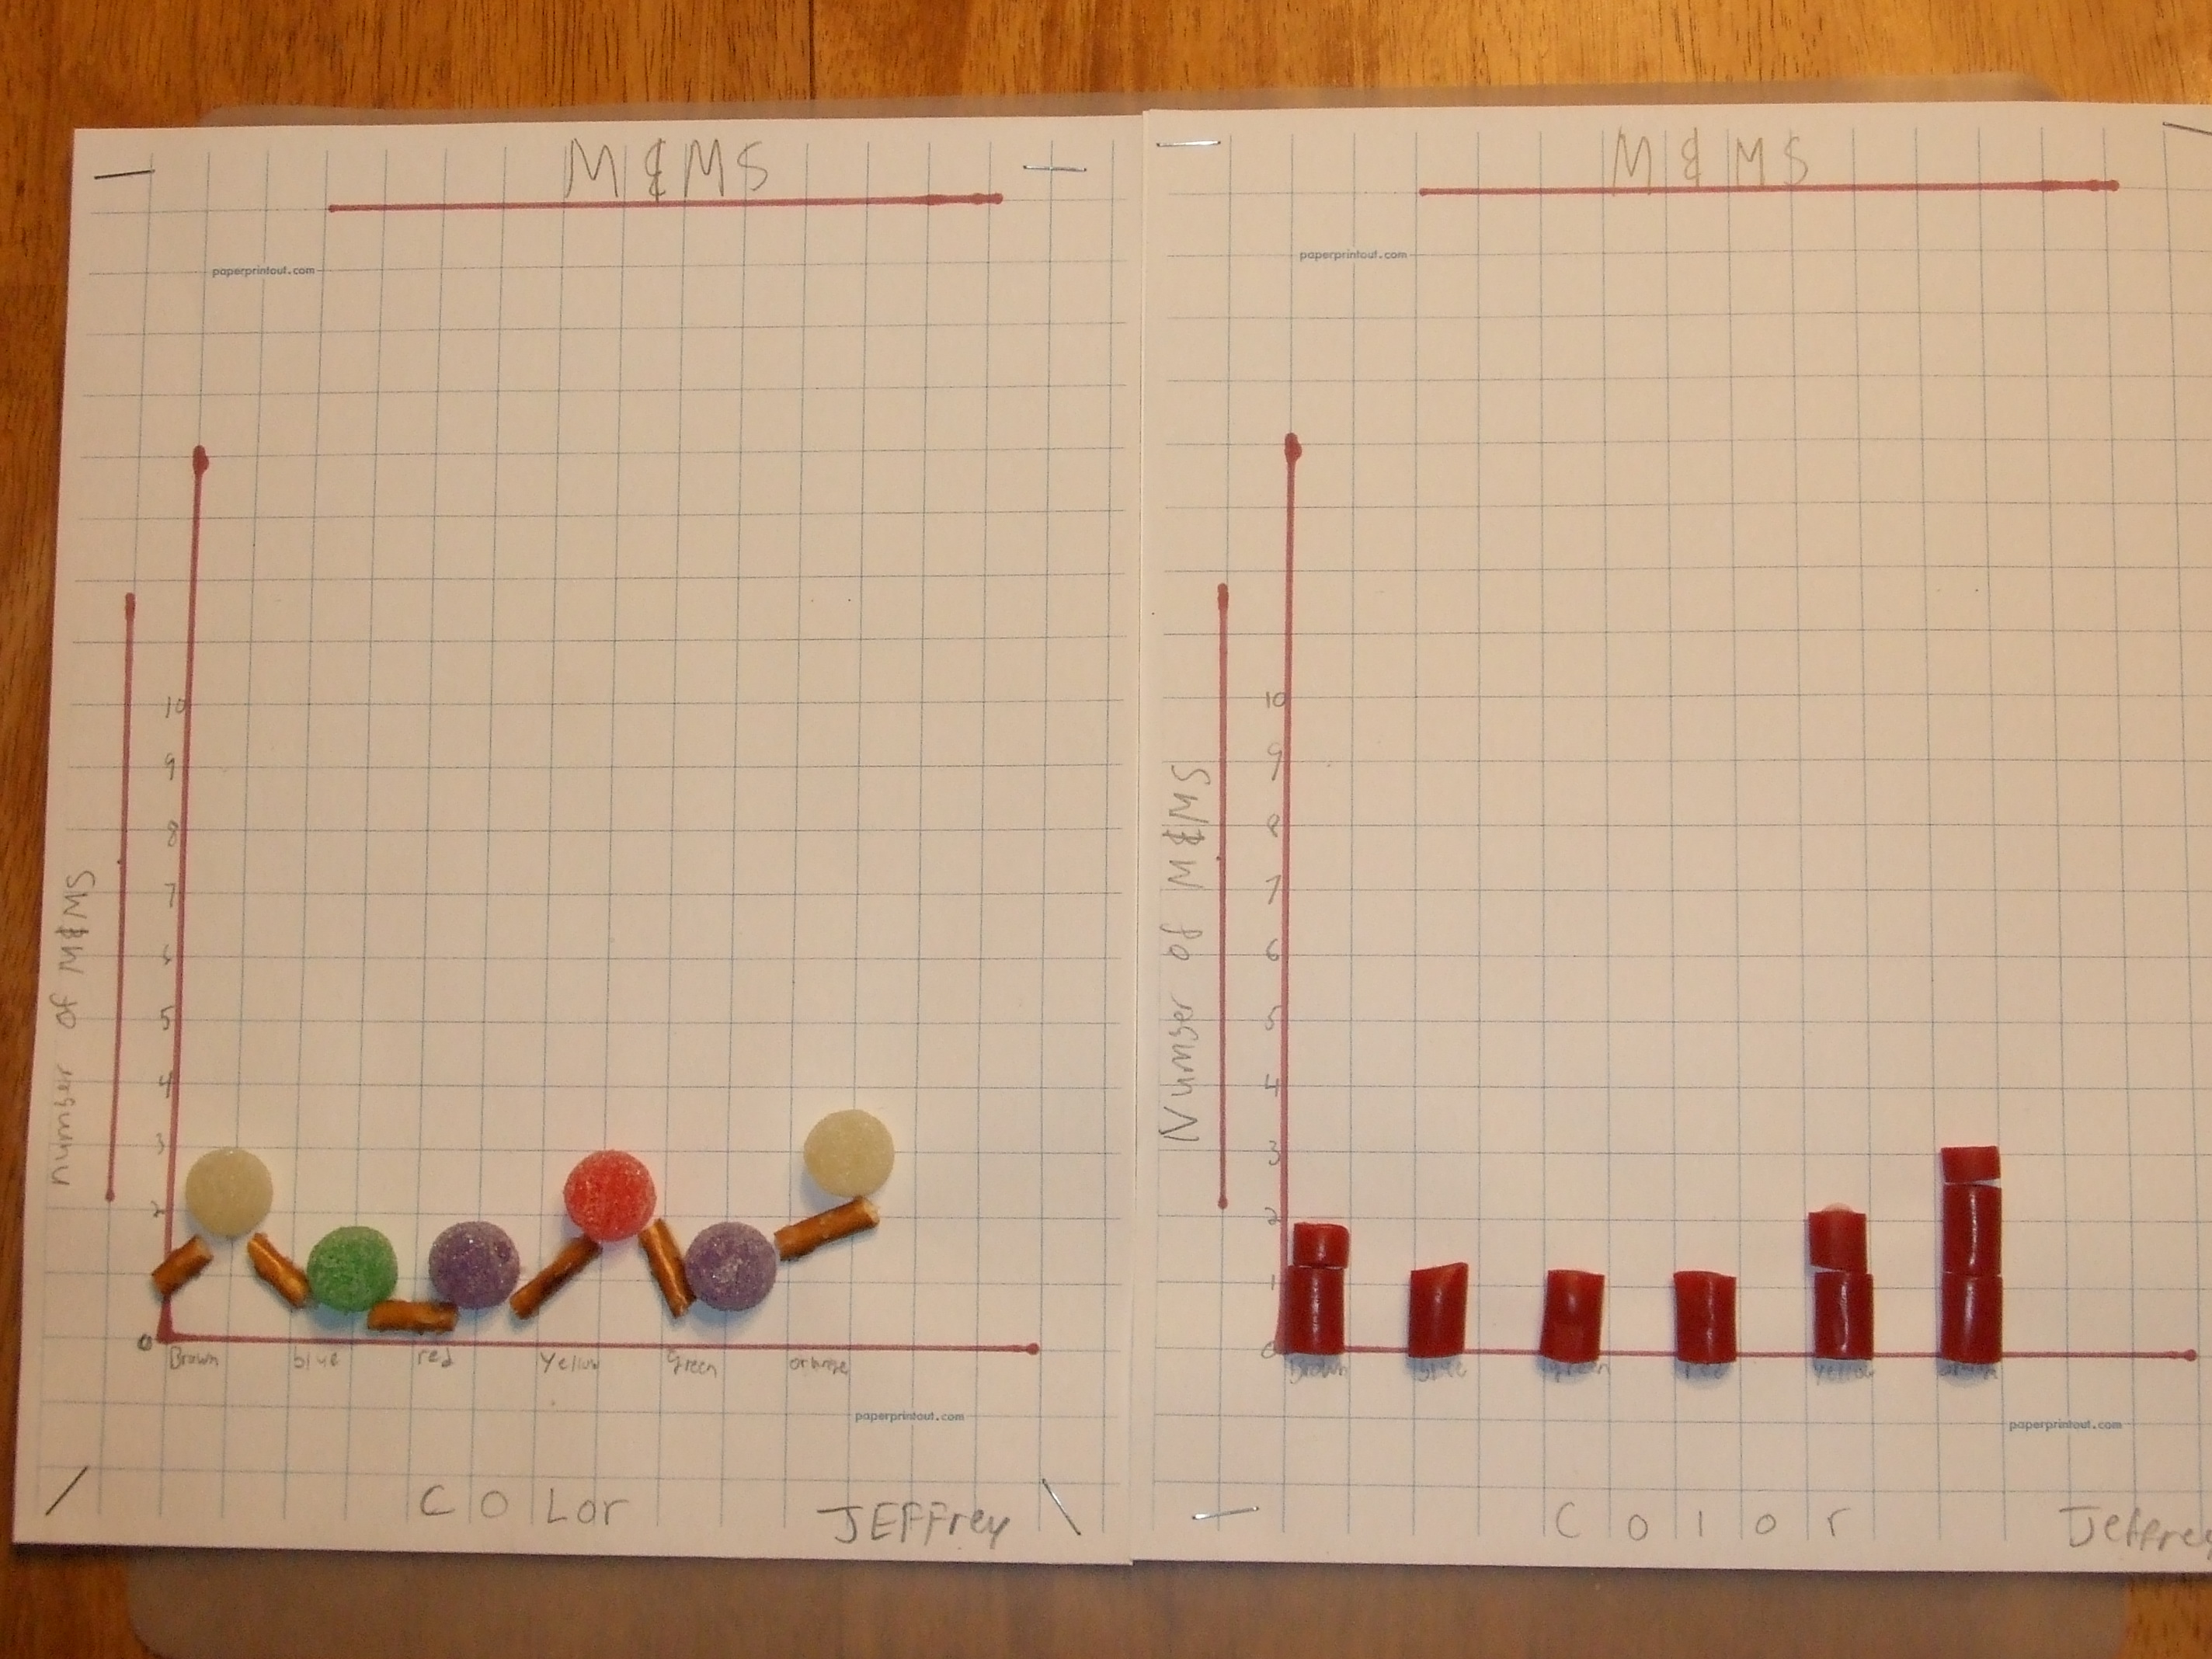
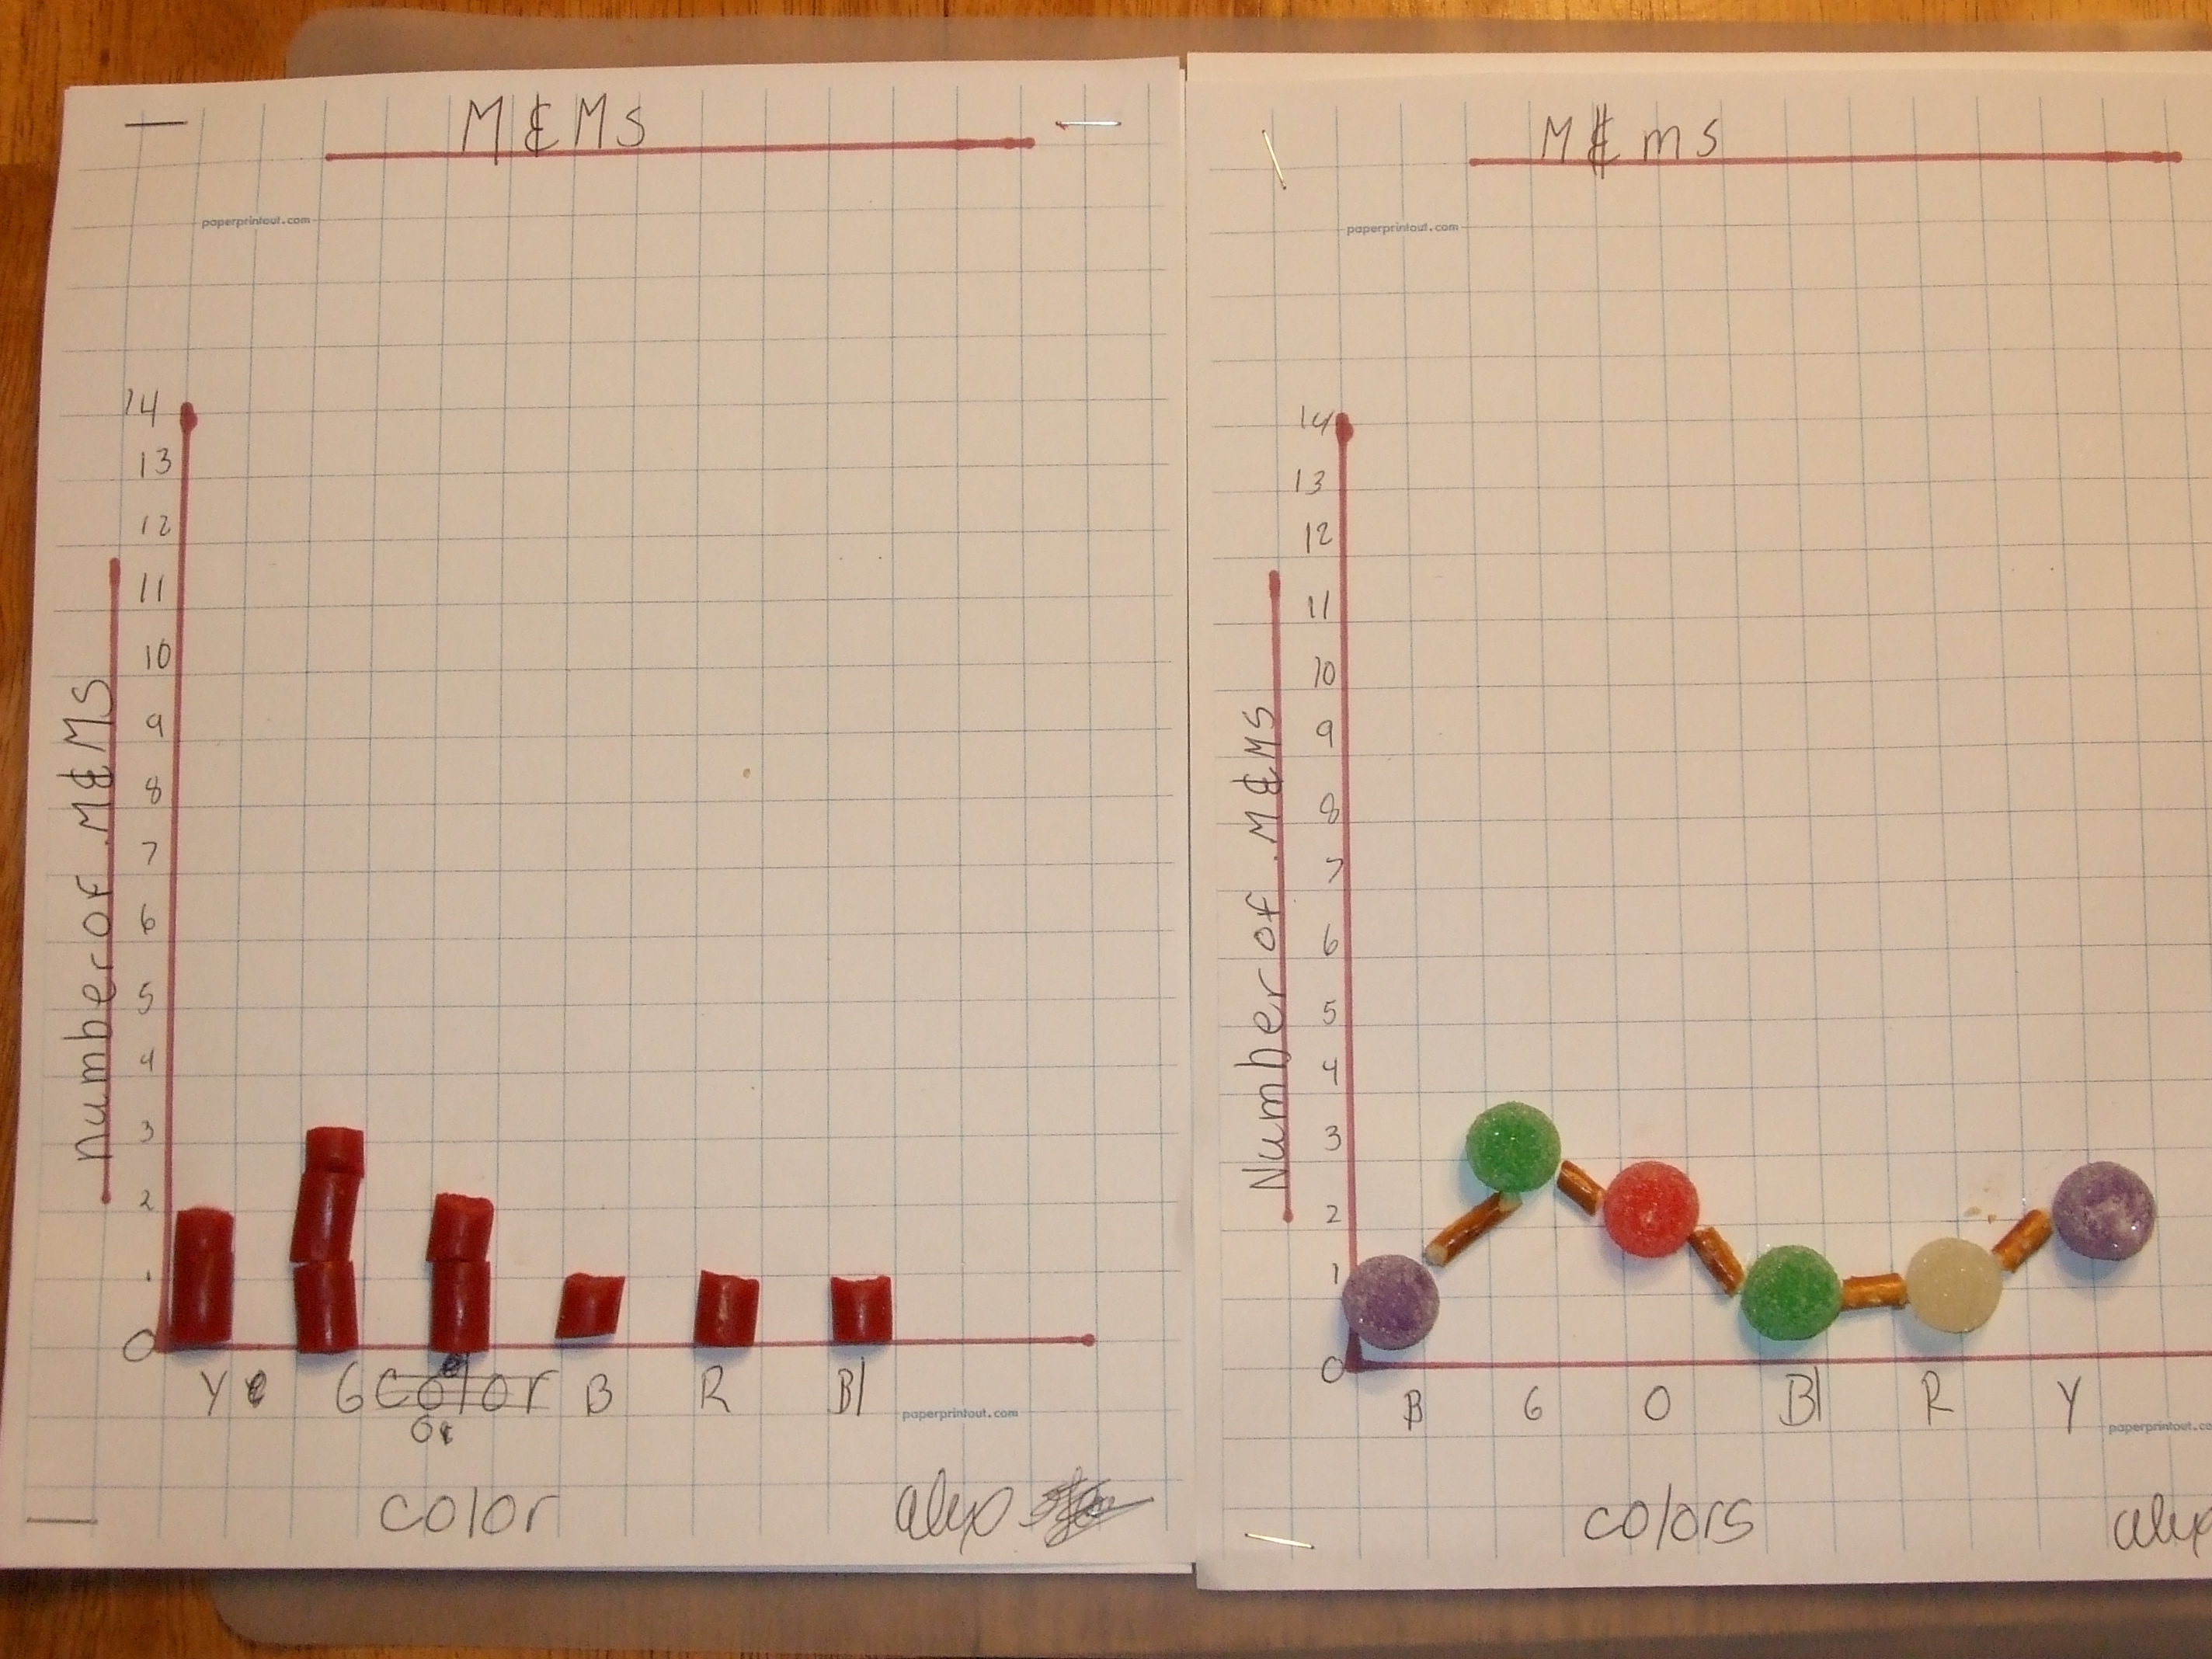
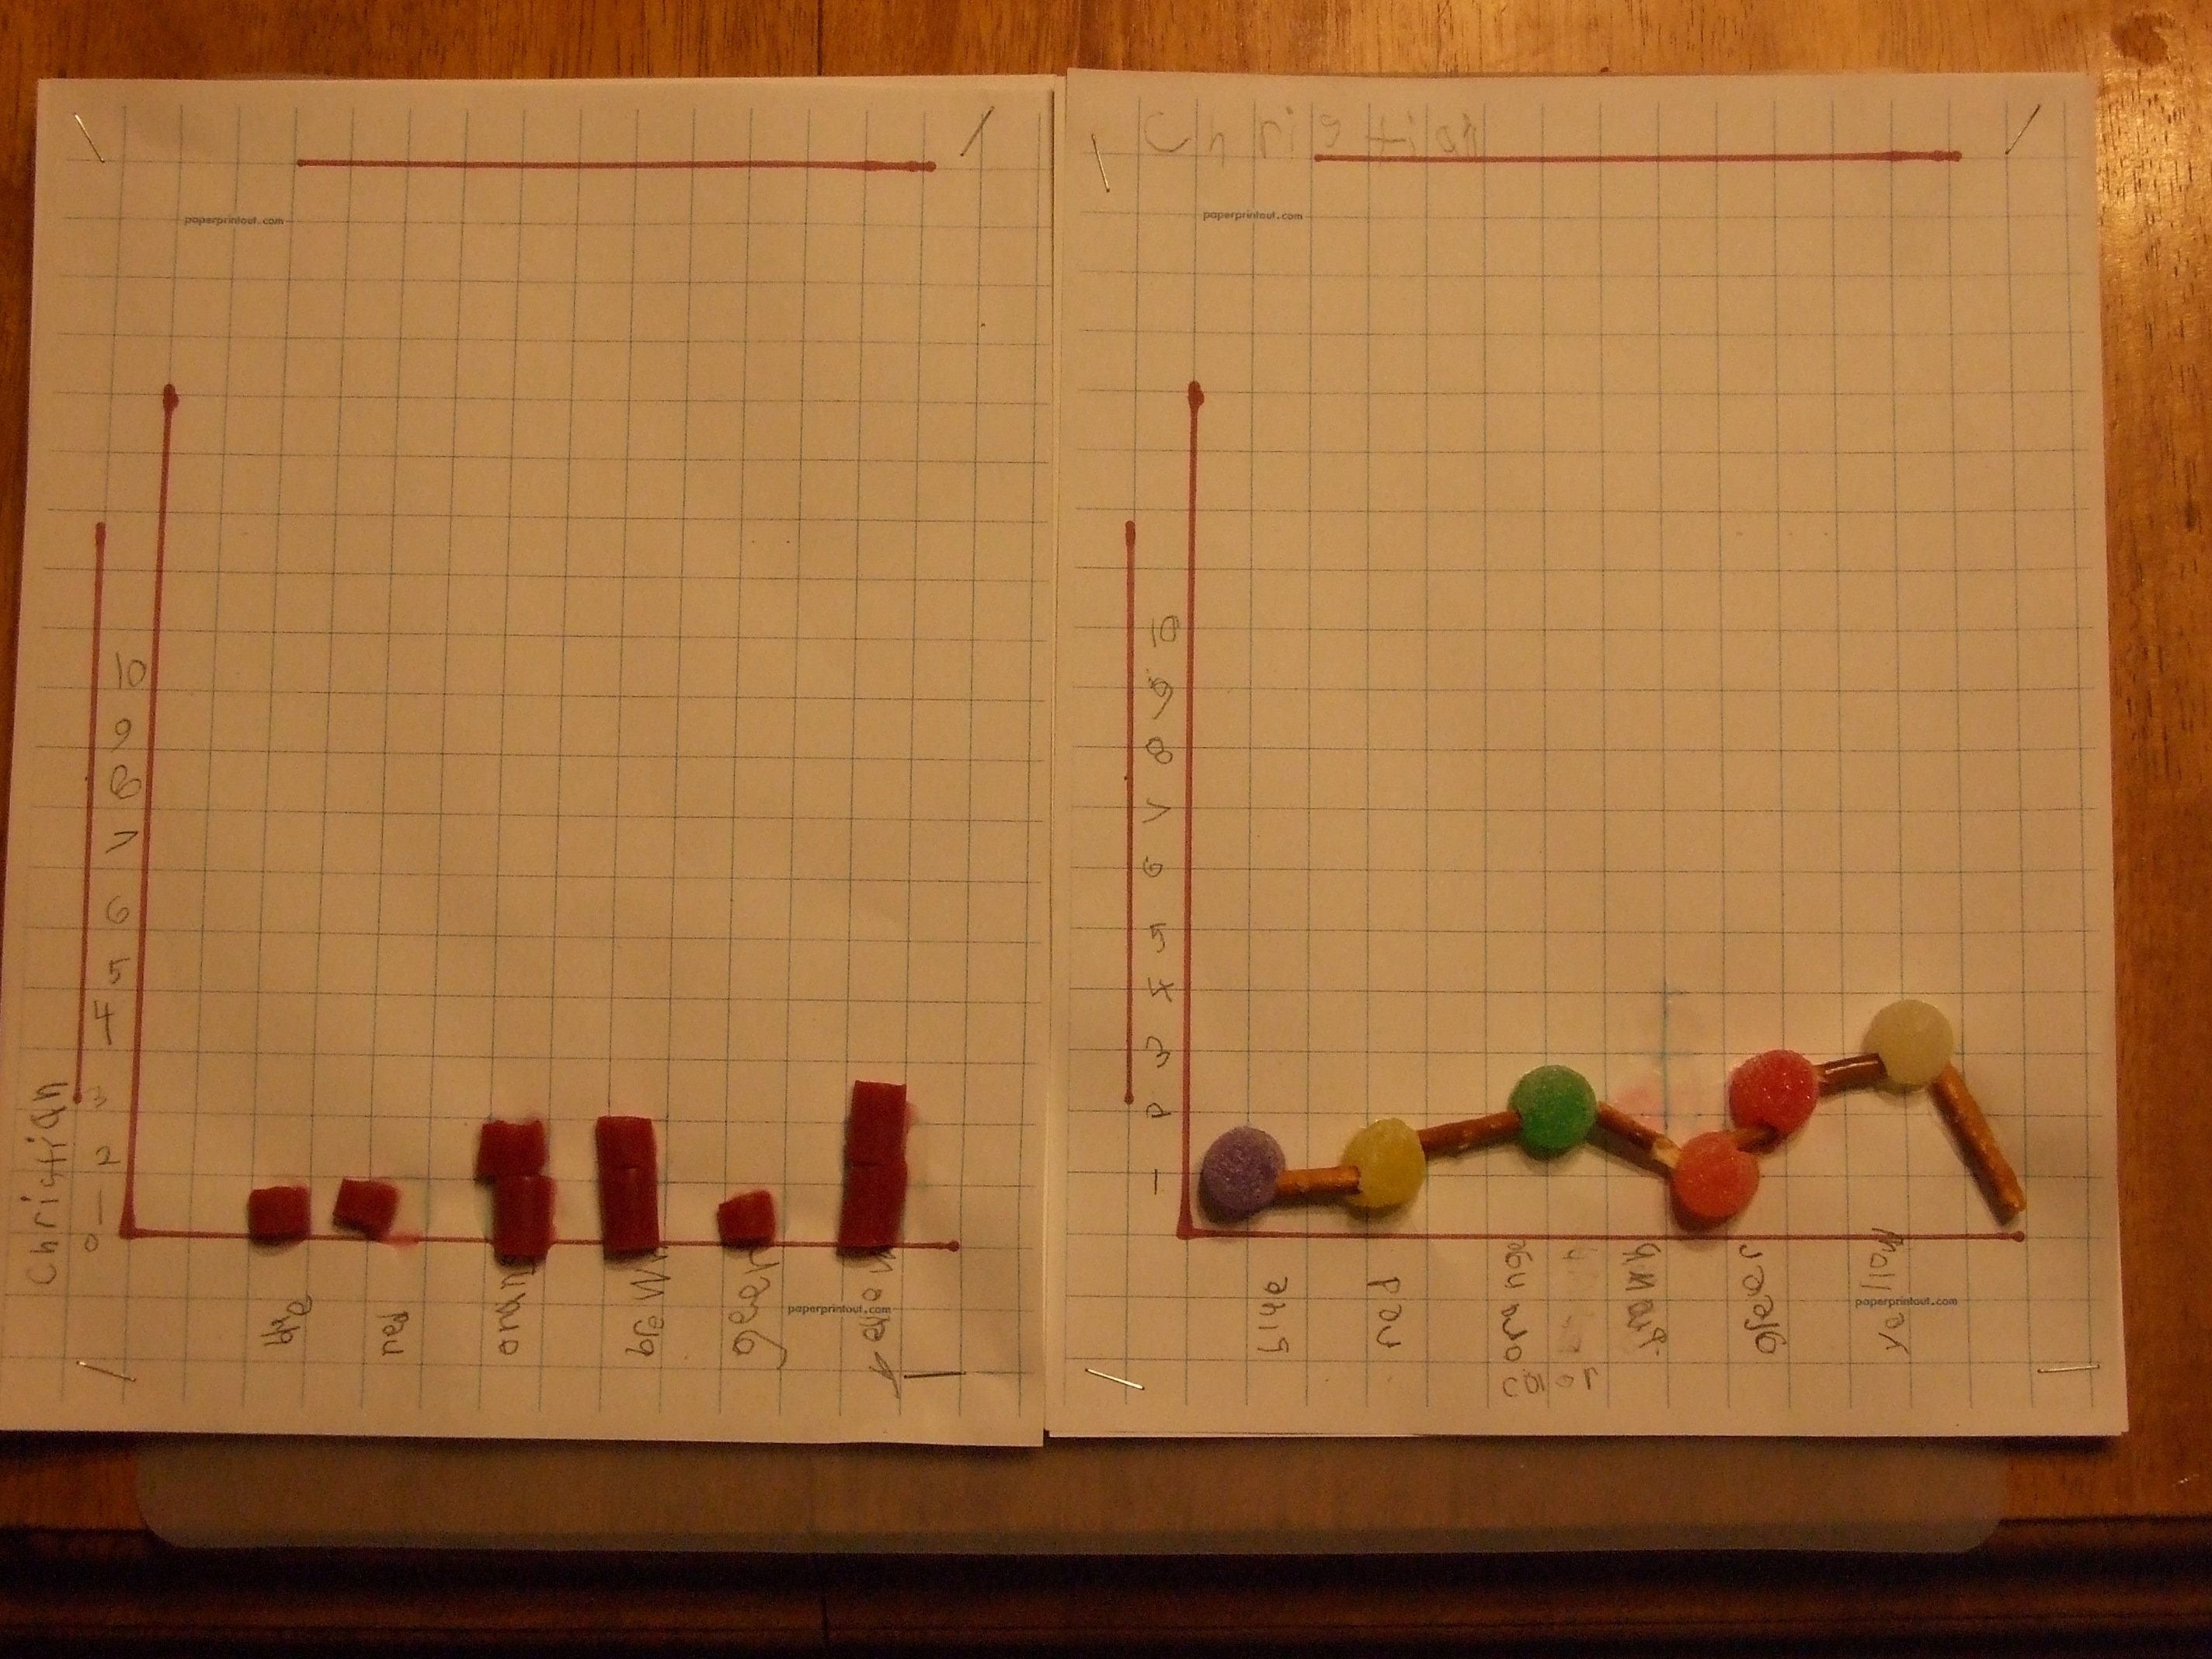
Student Work
Student-made bar and line graphs.
Instructional/Environment Modifications
This lesson was set up for a life skills class:
- Assistant for students with special needs
- Extra time
- Example to guide students
Related Resource
Reflections and Feedback
The lesson went well. The kids enjoyed the web site graphing because you could go back and forth between types of graphs, They really got the concept of reading graphs down well. They did a great job on taking their own data and transferring it into the candy graphs. The one thing I would change is I would use a smaller type of candy to mark the points on the line graph.
Students worked independently on the RCT graph pages and did an excellent job. All scoring in the 90% range.

