Learning Experience/Unit
Graphing by St. Lawrence-Lewis BOCES
Subject
Math, Science & Technology
Grade Levels
Intermediate, 5th Grade
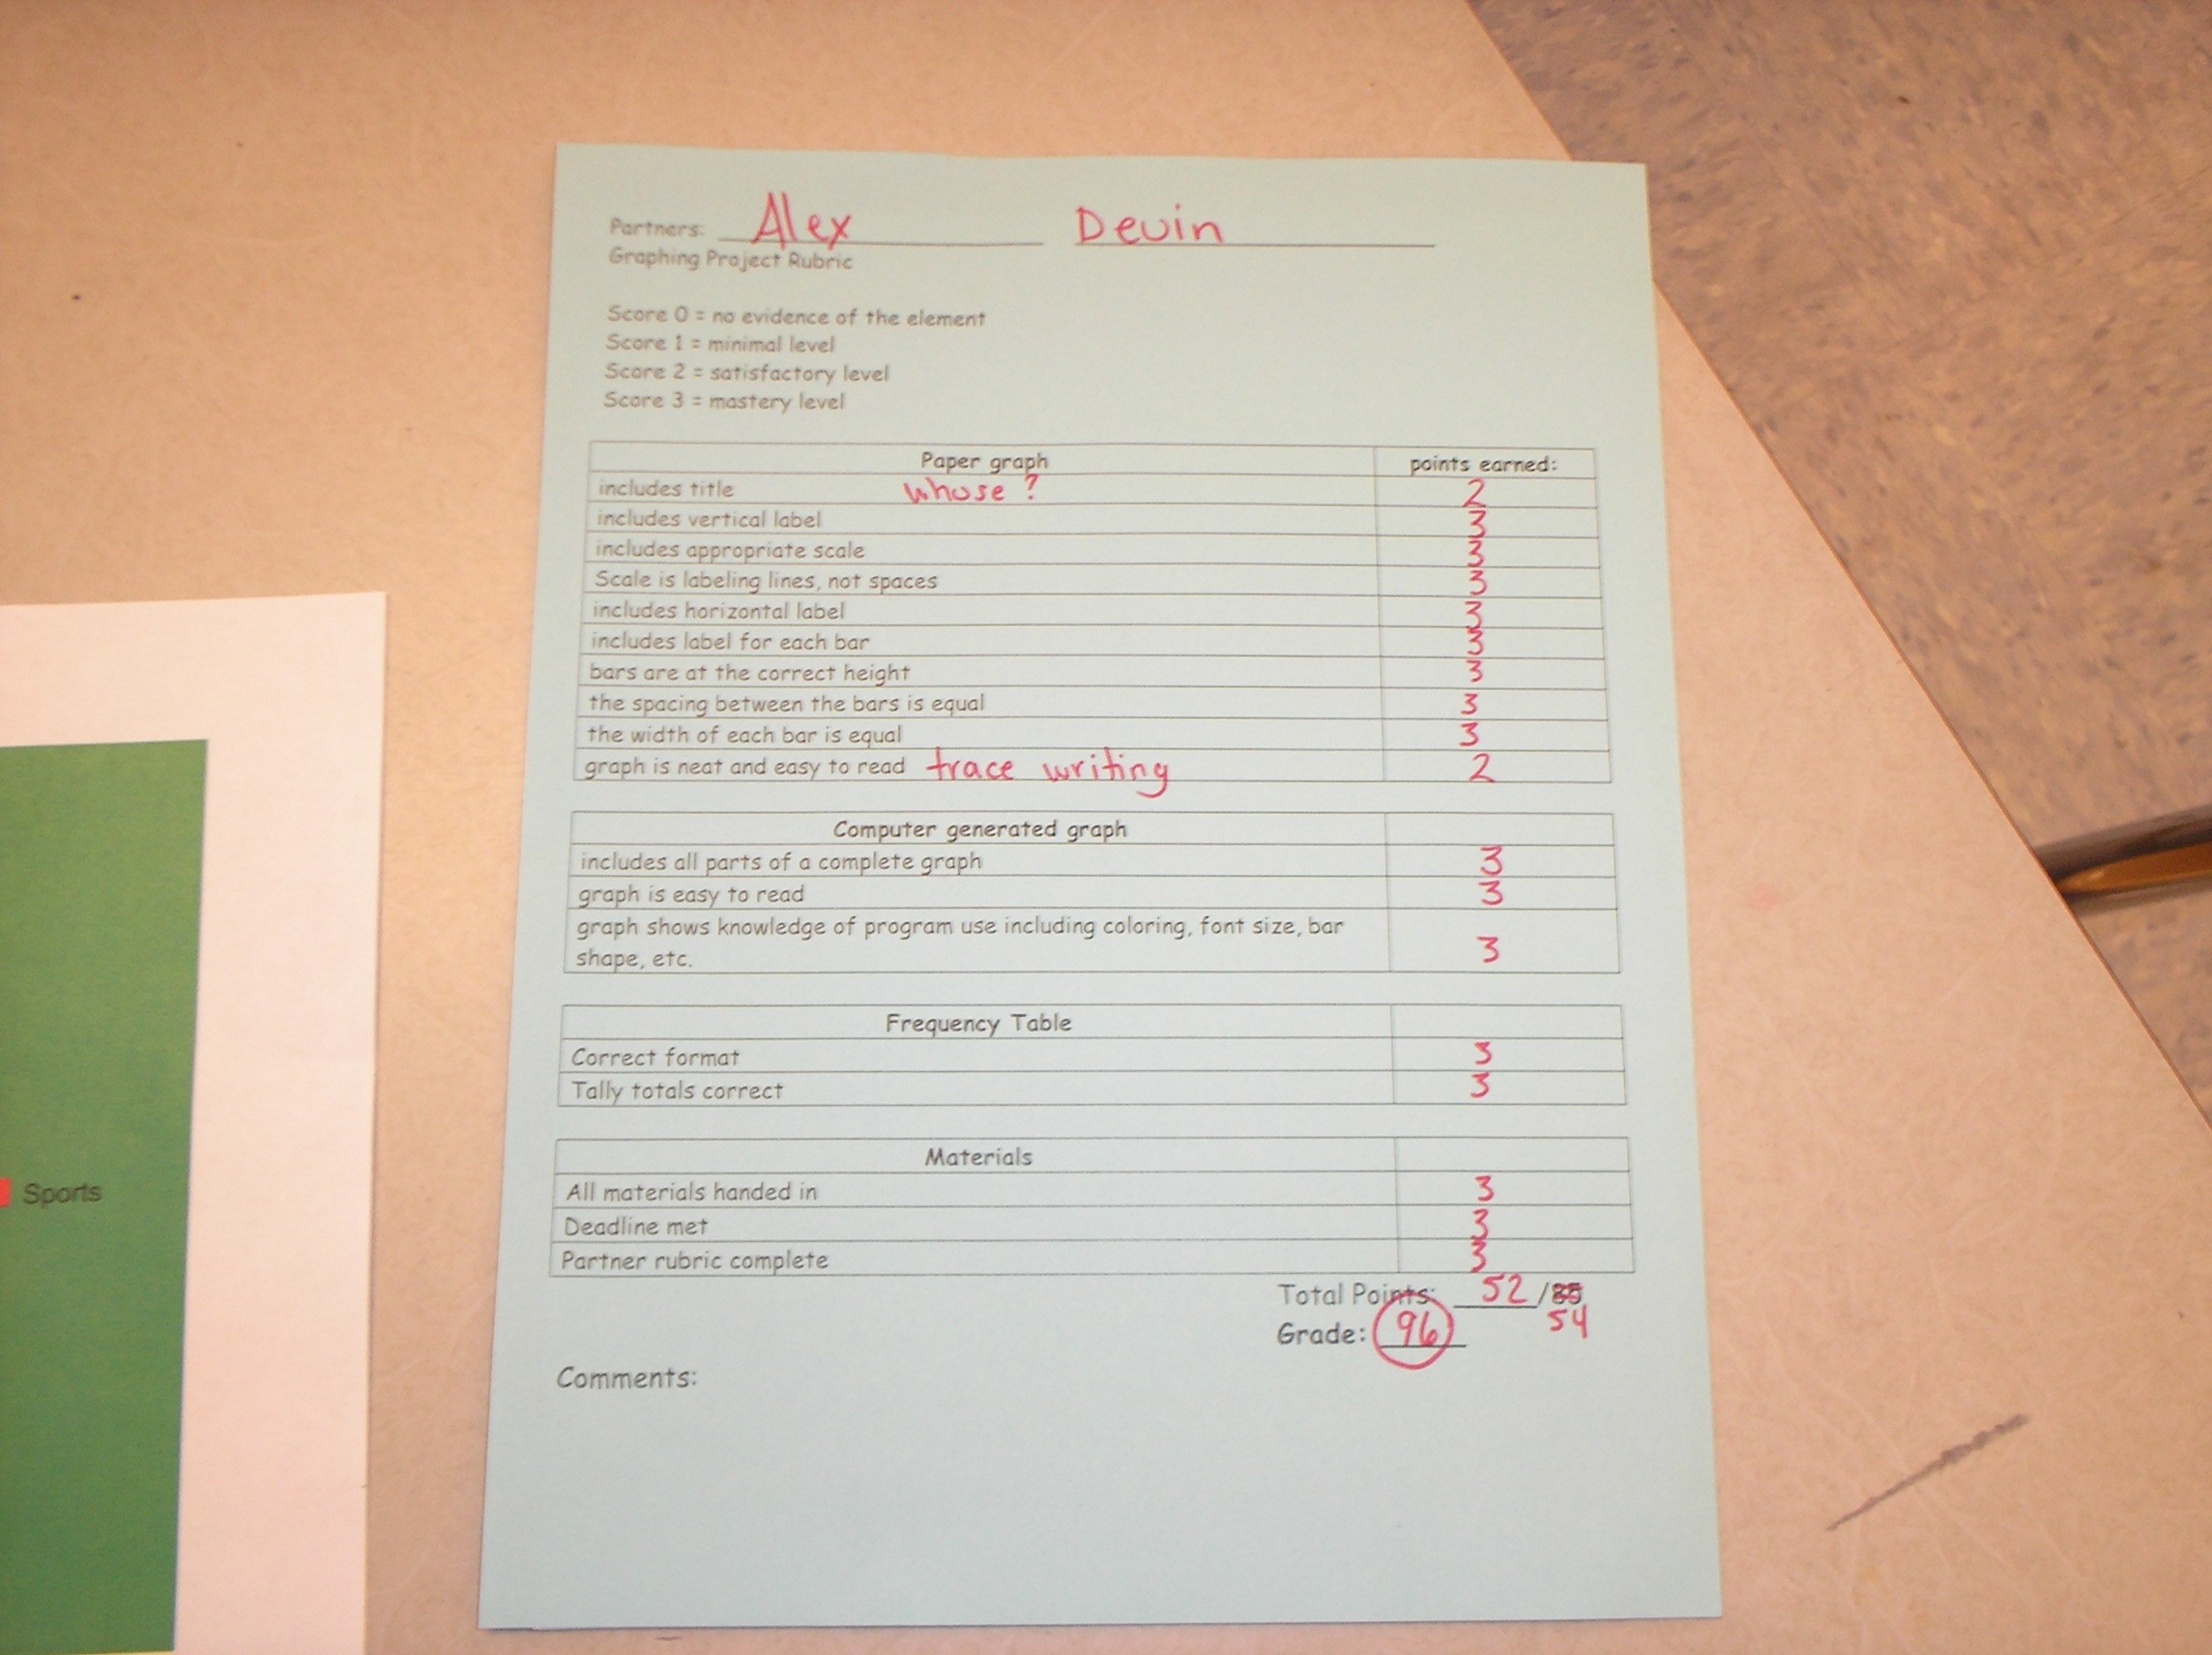
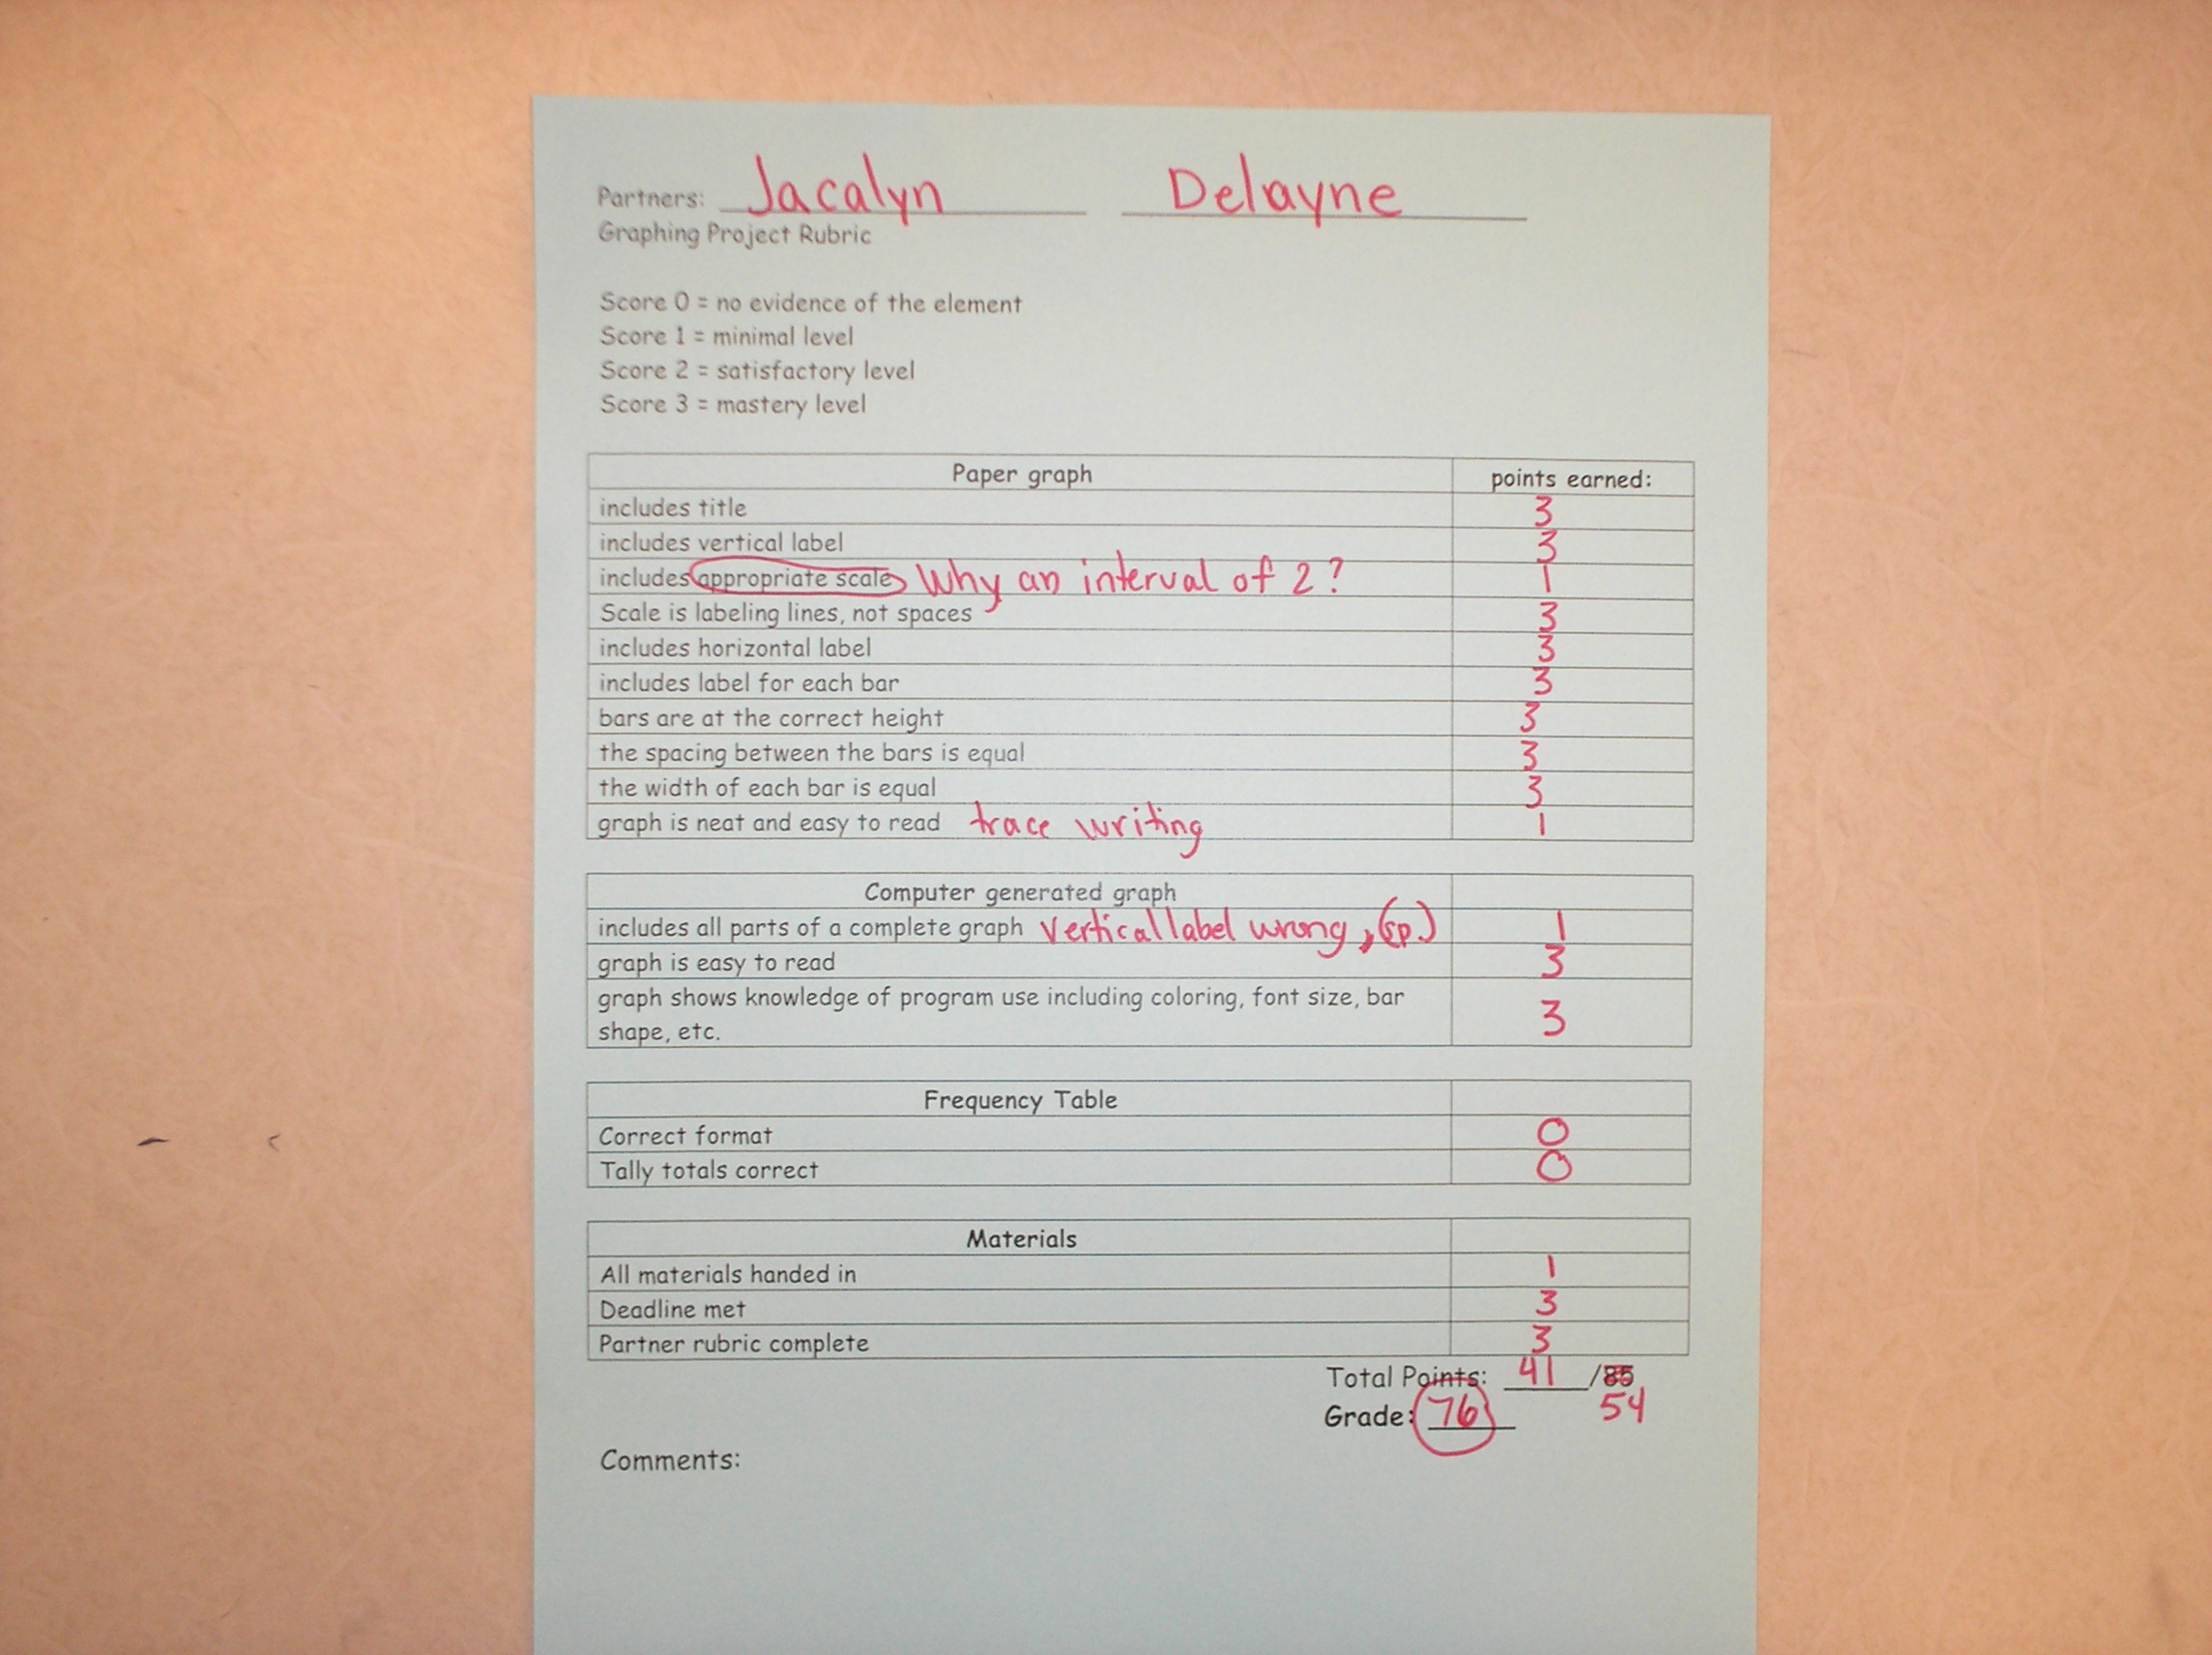
Assessment
Survey results
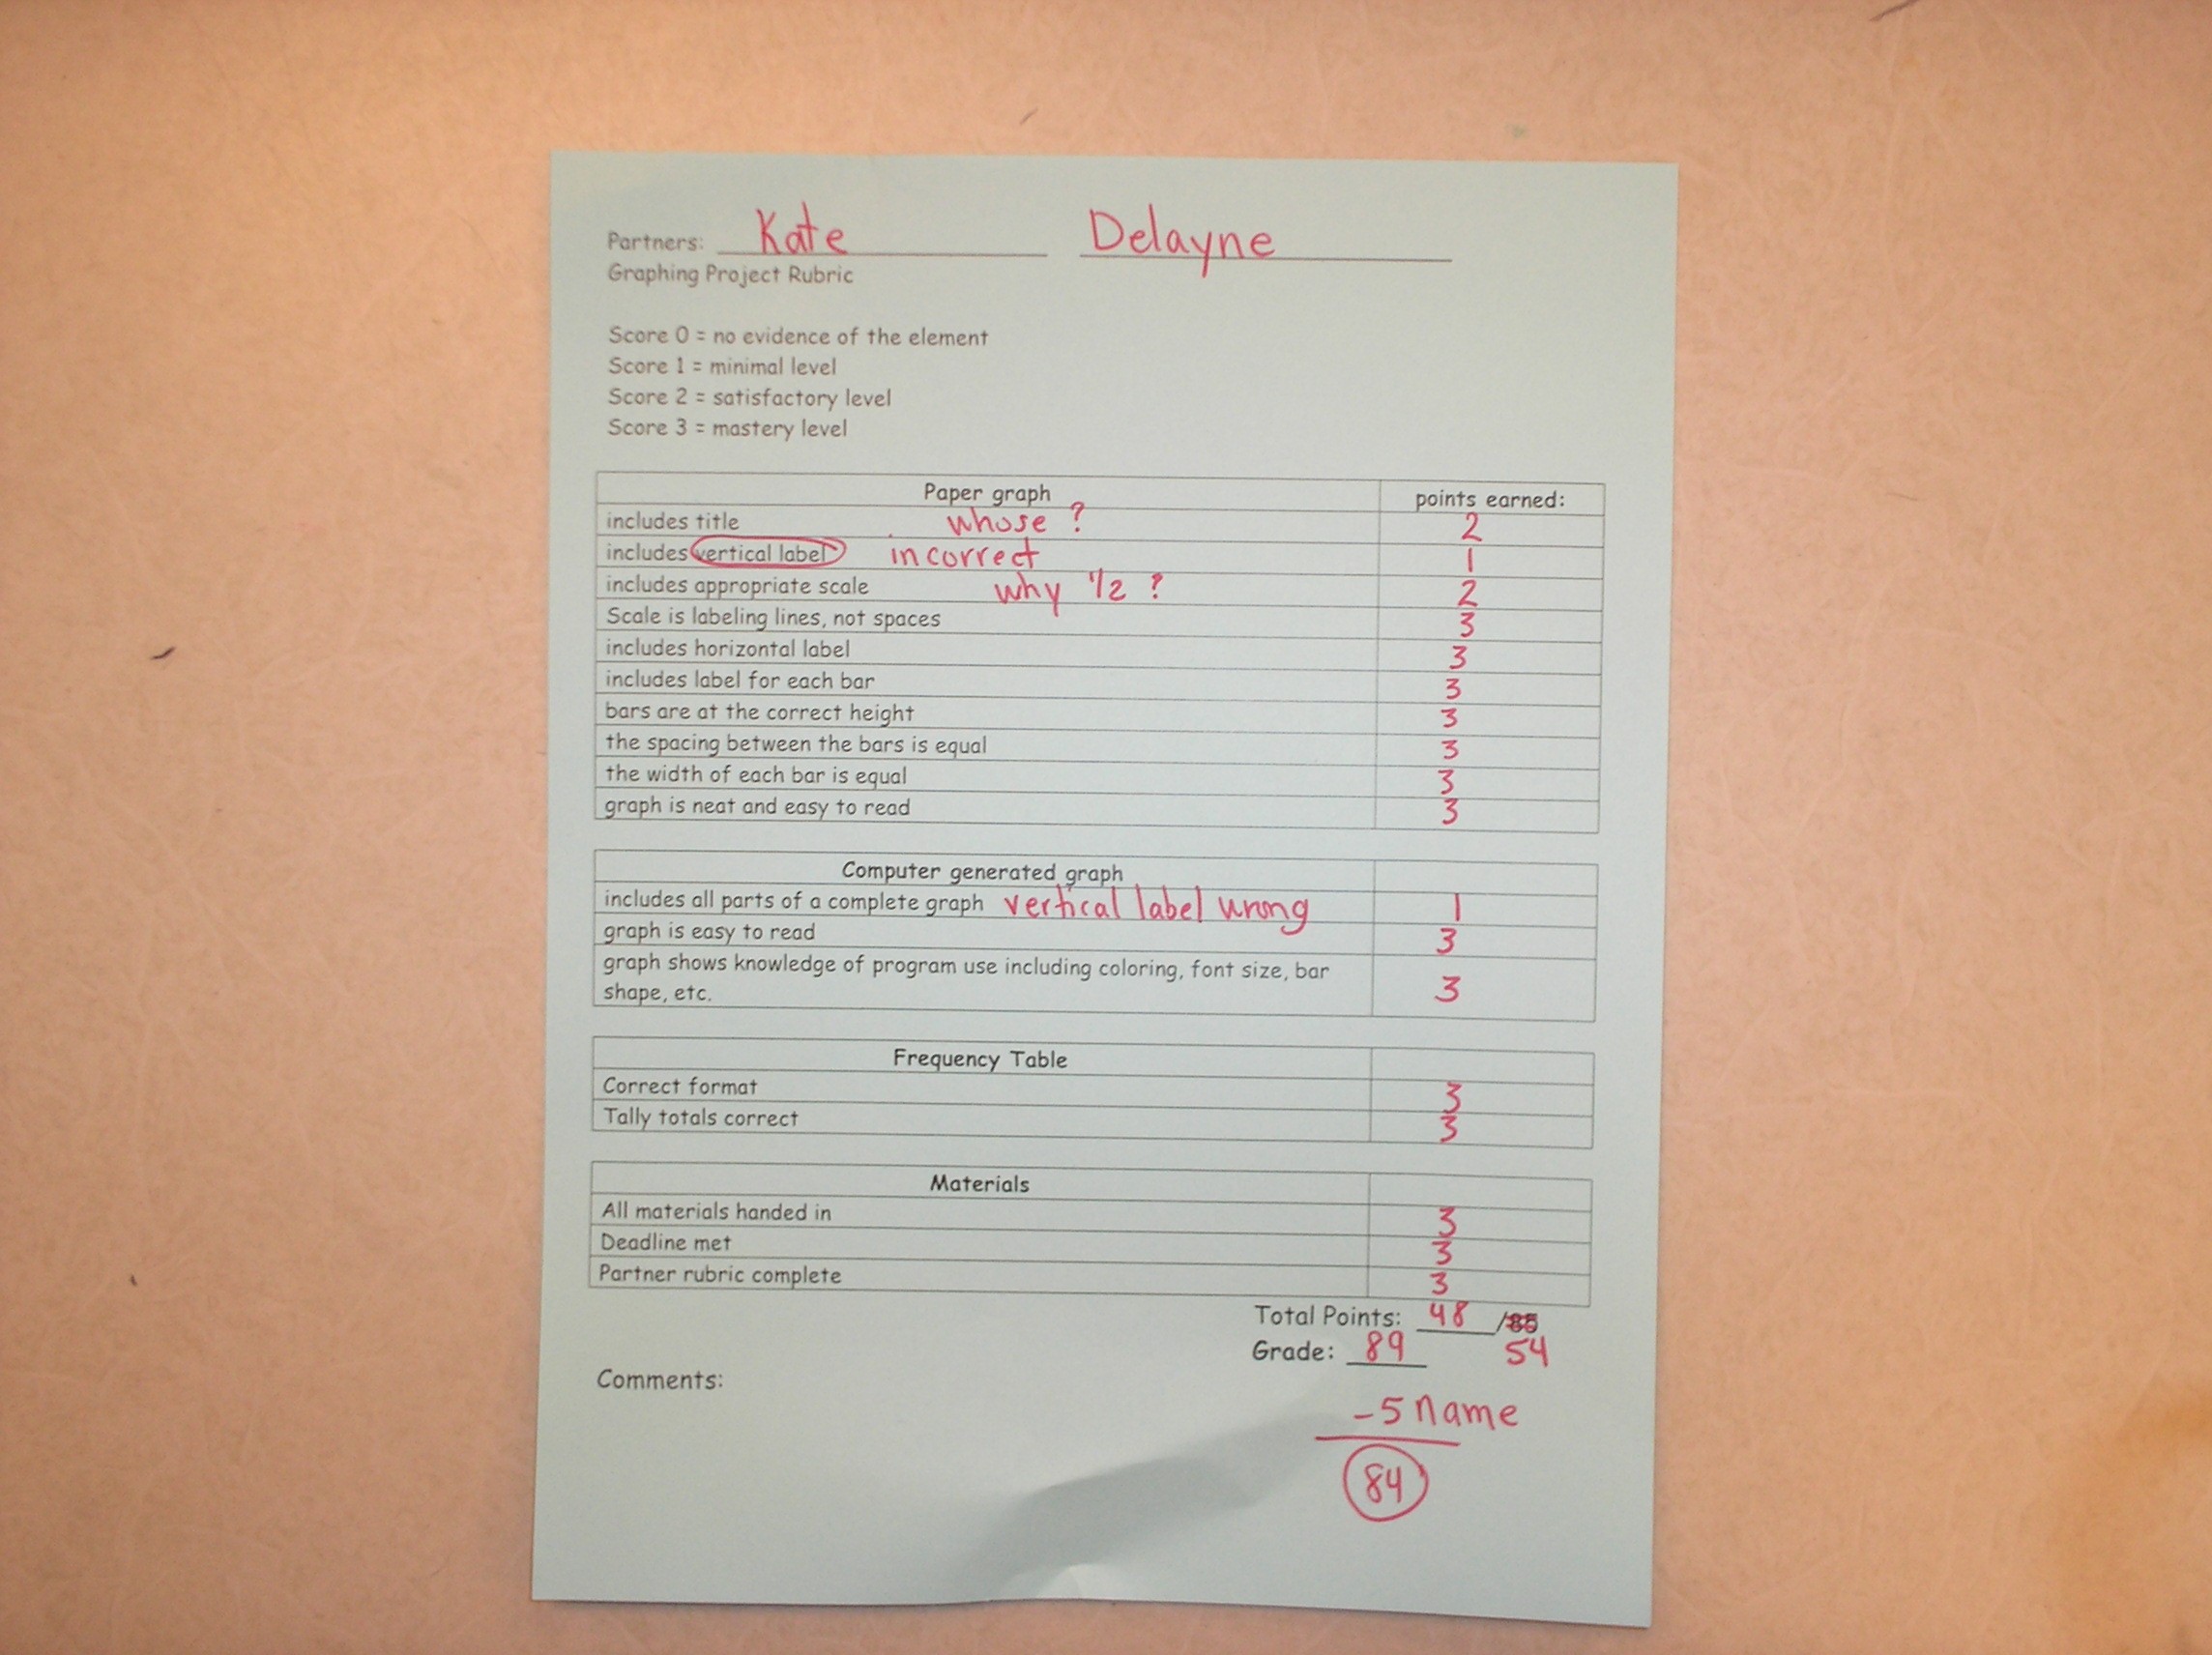
Rubric for paper graph & questions
Rubric for computer generated graph
Learning Context/ Introduction
Students will design surveys, and collect, organize, and graph information. Students will present their graphs to the class and answer student generated questions.
Duration
7 - 40-minute periods
Essential Question
Why use graphs to present information? How do I organize information and create a bar graph?
Instructional/Environment Modifications
Computer lab
LCD
PowerPoint
SMART Notebook software
SMART Board
Modifications
Provided extra class time to work on their individual graphs.
If necessary, struggling students may need an additional work sessions with the teacher to practice navigating the website.
Procedure
Day 1: Review frequency tables & bar graphs
- Use the SMART Board and Notebook file to share "bar graphs.notebook" *see attached files (If students do not already have shoulder partners, assign them a partner.)
- Show slide #2. Read & review directions together. Check for understanding of directions.
- Set timer on board for 3 minutes.
- After 3 minutes, have students share ideas about "Why do we use graphs to share information?" Add their ideas to slide #3.
- Continue through slides discussing definitions & examples of bar graphs. Be sure to click on the 2 off white boxes on slide #4. Label important parts of a bar graph on slide #5.
- Use split screen function to show slide #5 & #6 together. Have students answer questions using the graph.
- Discuss scale & intervals & highlight key words in the definitions on slide #7.
- Survey each student, one by one, about their favorite fruit and record the information on slide #9 to teach frequency tables.
- Use this information to make a bar graph about the class's favorite fruits. (slide# 10)*click split screen button on task bar to show this slide and next slide
- Use the steps on slide #11. *use split screen
- Slide 12: Have students orally share what they learned today. Also have them reflect back on the essential questions; and share orally.
Day 2: Introduce project
- Hand out graphing project direction sheet. (see attached file graphing project.pdf) Read & discuss together answering any questions they have.
- Assign partners and have them create their survey question and 4-6 choices.
- Teacher will check and initial survey questions to be sure that no teams are doing the same question.
- Teams should also make their frequency tables so they are ready to be filled in tomorrow.
*If all teams finish, they can begin surveying the class.
Day 3: Conduct surveys & complete frequency tables
- Each "team" will take turns asking their survey question orally to the rest of the class. Teams will record the information onto their frequency table.
- After each team has surveyed the class, partners will work together to complete their frequency table and begin the rough draft of their bar graph.
Day 4: Show graphing website
- Teacher should log onto www.nces.ed.gov/nceskids/createagraph/ with LCD projector.
- Use the information from the class survey about favorite fruit from yesterday to create a bar graph. Discuss each step as you do it.
- This website is very self explanatory. Follow the directions on the screen. Be sure to discuss the tab buttons on the right hand side with the students. Fill in the data information first. Then you can play and have fun with colors, shapes, fonts, etc.
Day 5 & Day 6: Creating graphs with partners
- Each team will create a computer generated bar graph using their survey information.
- Each team also needs to make a paper copy using graph paper.
- My classes are lucky to have daily workshop/center time for 40-minutes per day. All three 5th grade teachers allowed them to use their classroom computers during this time. So they had a 3 day deadline to finish their graphs outside of class while I moved on to other topics in math class.
Day 7: Graph presentations via carousel
- Partners will present both graphs (paper & computer generated) to the class by hanging them around the room.
- All students will rotate around the room and write 2 positive comments and 1 suggestion for each teams' graphs onto a Post-it note. Students will leave Post-it notes at each station for the "authors" of the graphs to look at later. (*We have done this before and my students know the rules for sharing comments and making constructive suggestions.)
- Allow students time to go back to their own projects to read comments from other students.
- Allow time for questions if students have them.
- Each student will complete a partner rubric sheet to assess their partner's work. (see attached)
graphing project.pdfpartner rubric.pdfbar graphs.notebook
Reflections and Feedback
This was a very enjoyable lesson for me to teach. Watching the students so engaged in a lesson was very satisfying. They often asked later when we could do it again. My 3 students who are classified as learning disabled in math did an excellent job without any modifications on this project.
What I learned!
Next time I do this lesson, I will take it one step further to have the students write 3 questions that could be answered by others using their graphs. During the carousel activity, each student could answer the questions on a sheet of paper and I would have another assessment measure. Students would love playing teacher and explaining the correct answers to the rest of the class afterward.
I also realized this was a lot of time to commit to one skill of the many we need to teach to prepare for the state math test in March. Next time, I will teach bar graphs and line graphs. Then I will split the teams and have some make bar graphs and some do line graphs. The same website could be used. A fellow teacher at peer review gave me the fabulous idea to use exercise, like jumping rope or doing jumping jacks, and measuring the numbers done in the 1st minute, 2nd minute, 3rd minute, etc., then graph the change of the data over time. What a fun and healthy idea! I can't wait to try it next year.
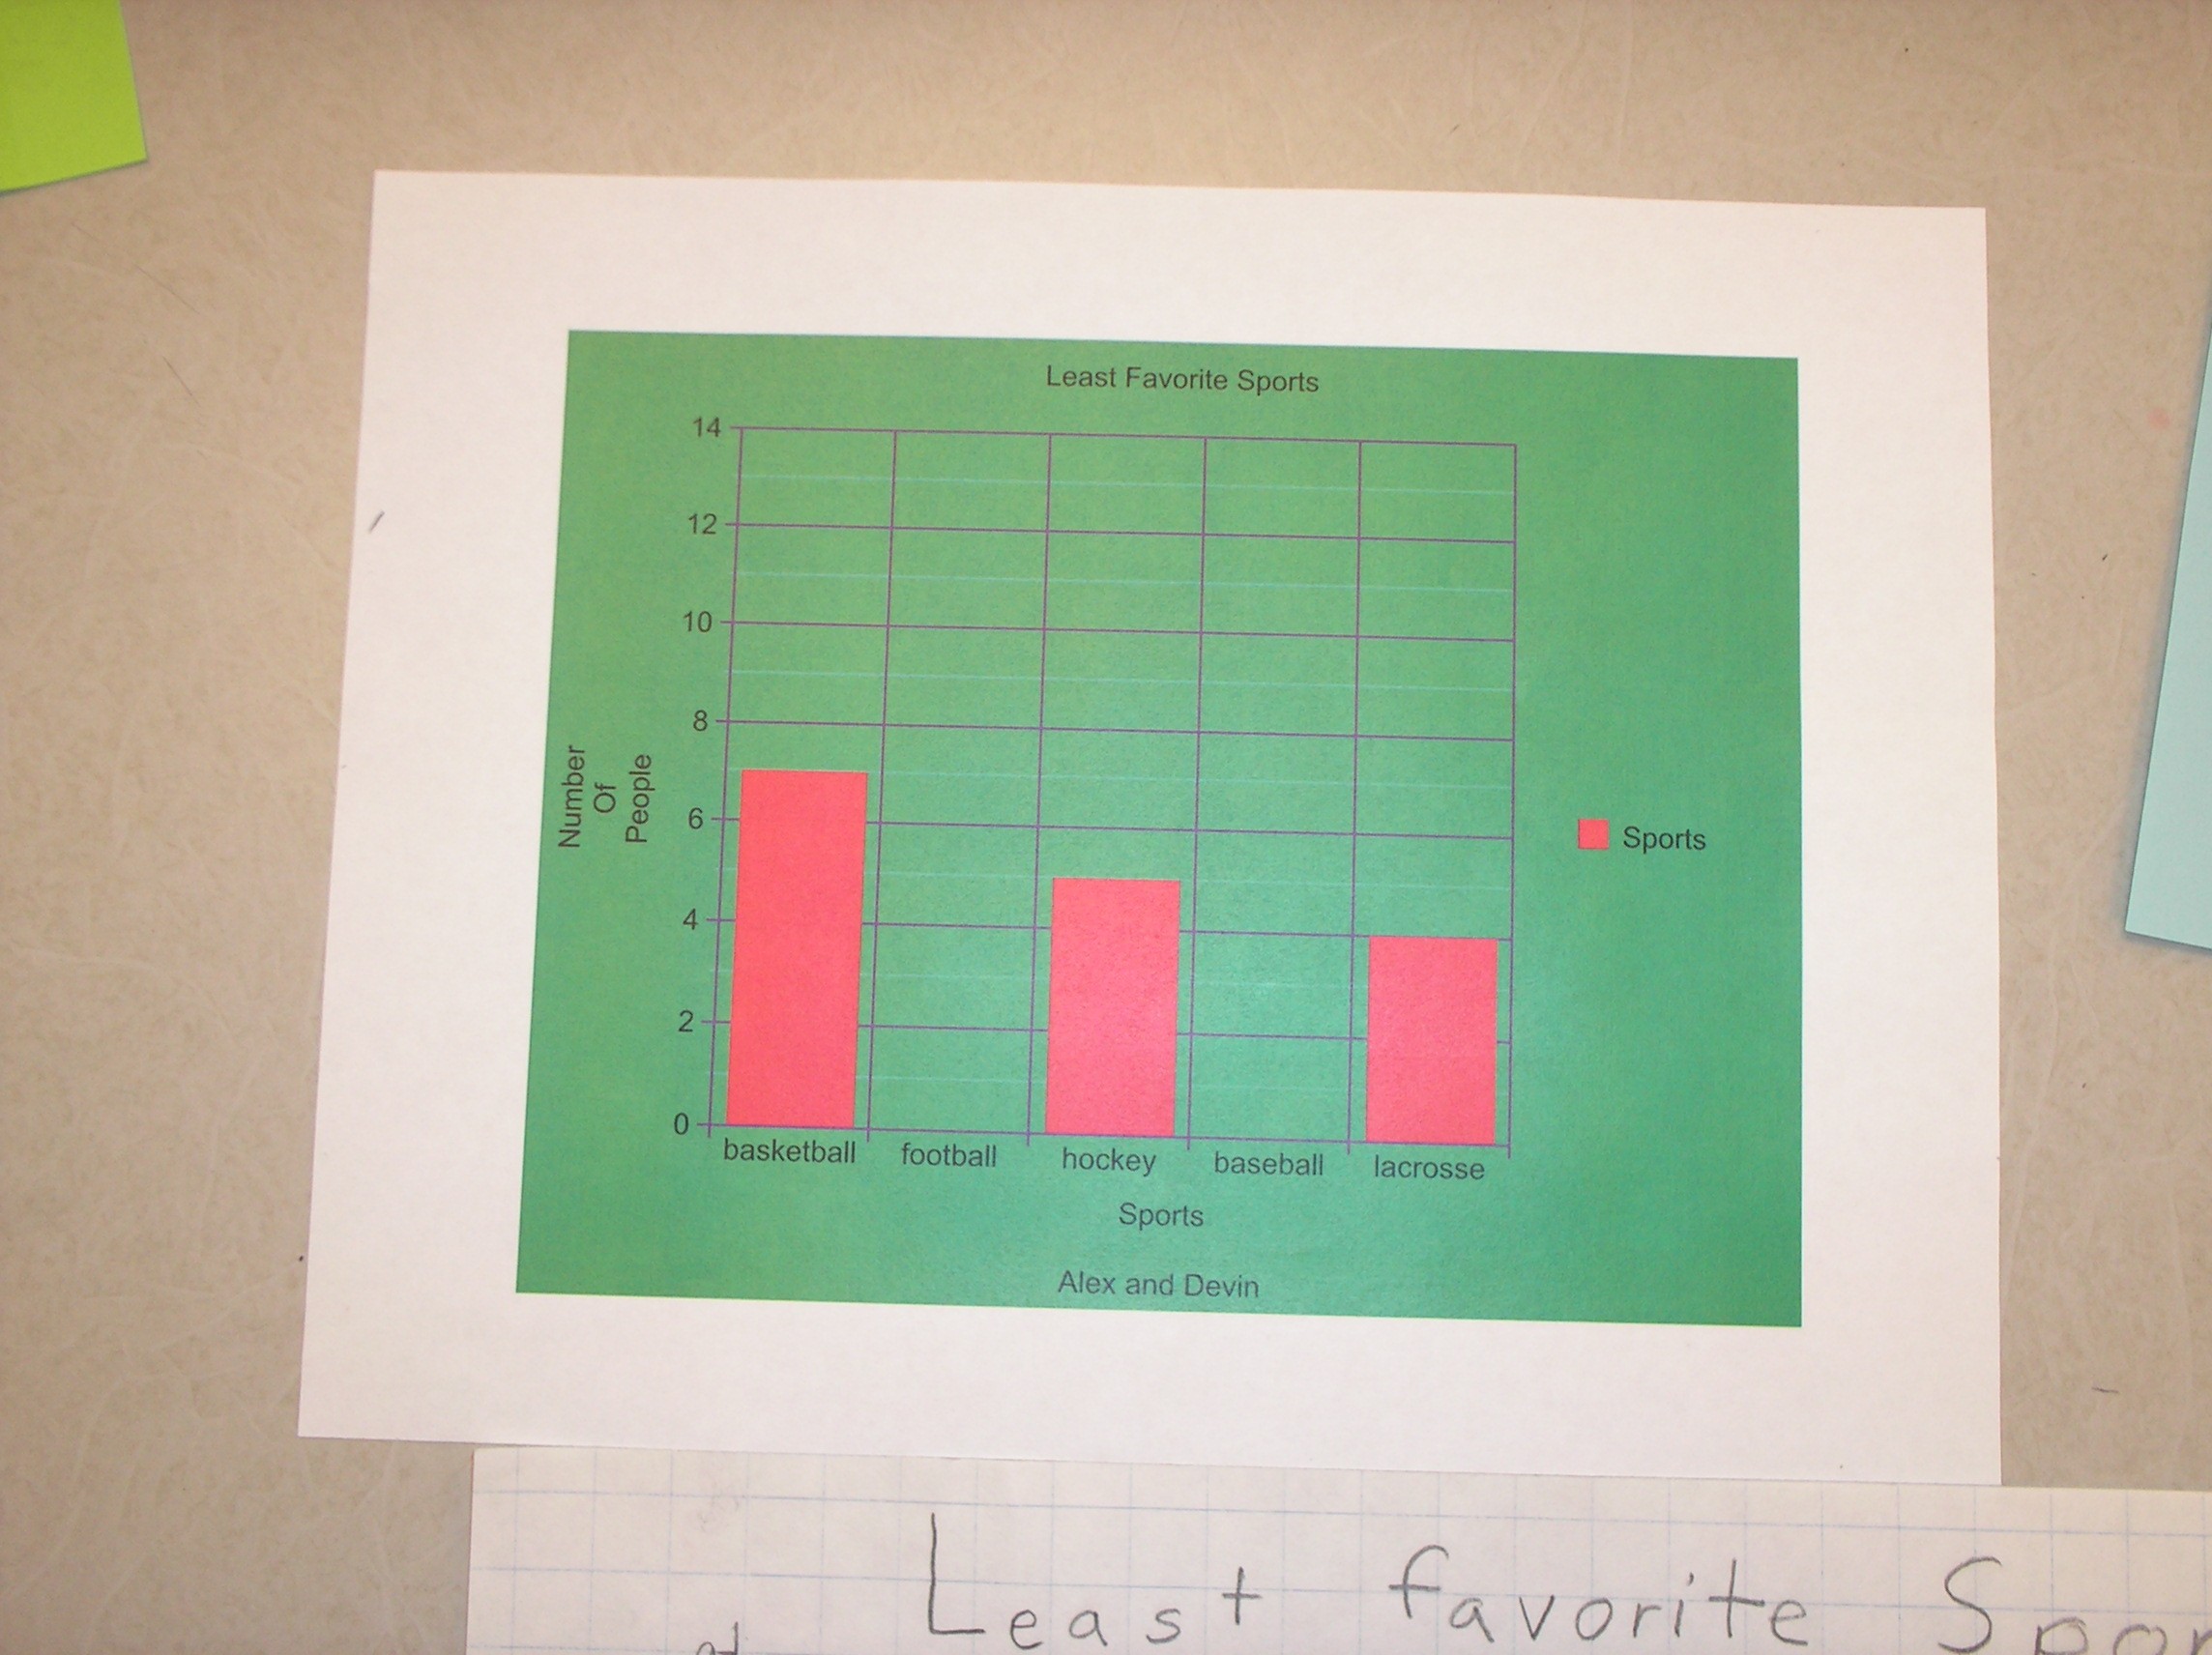
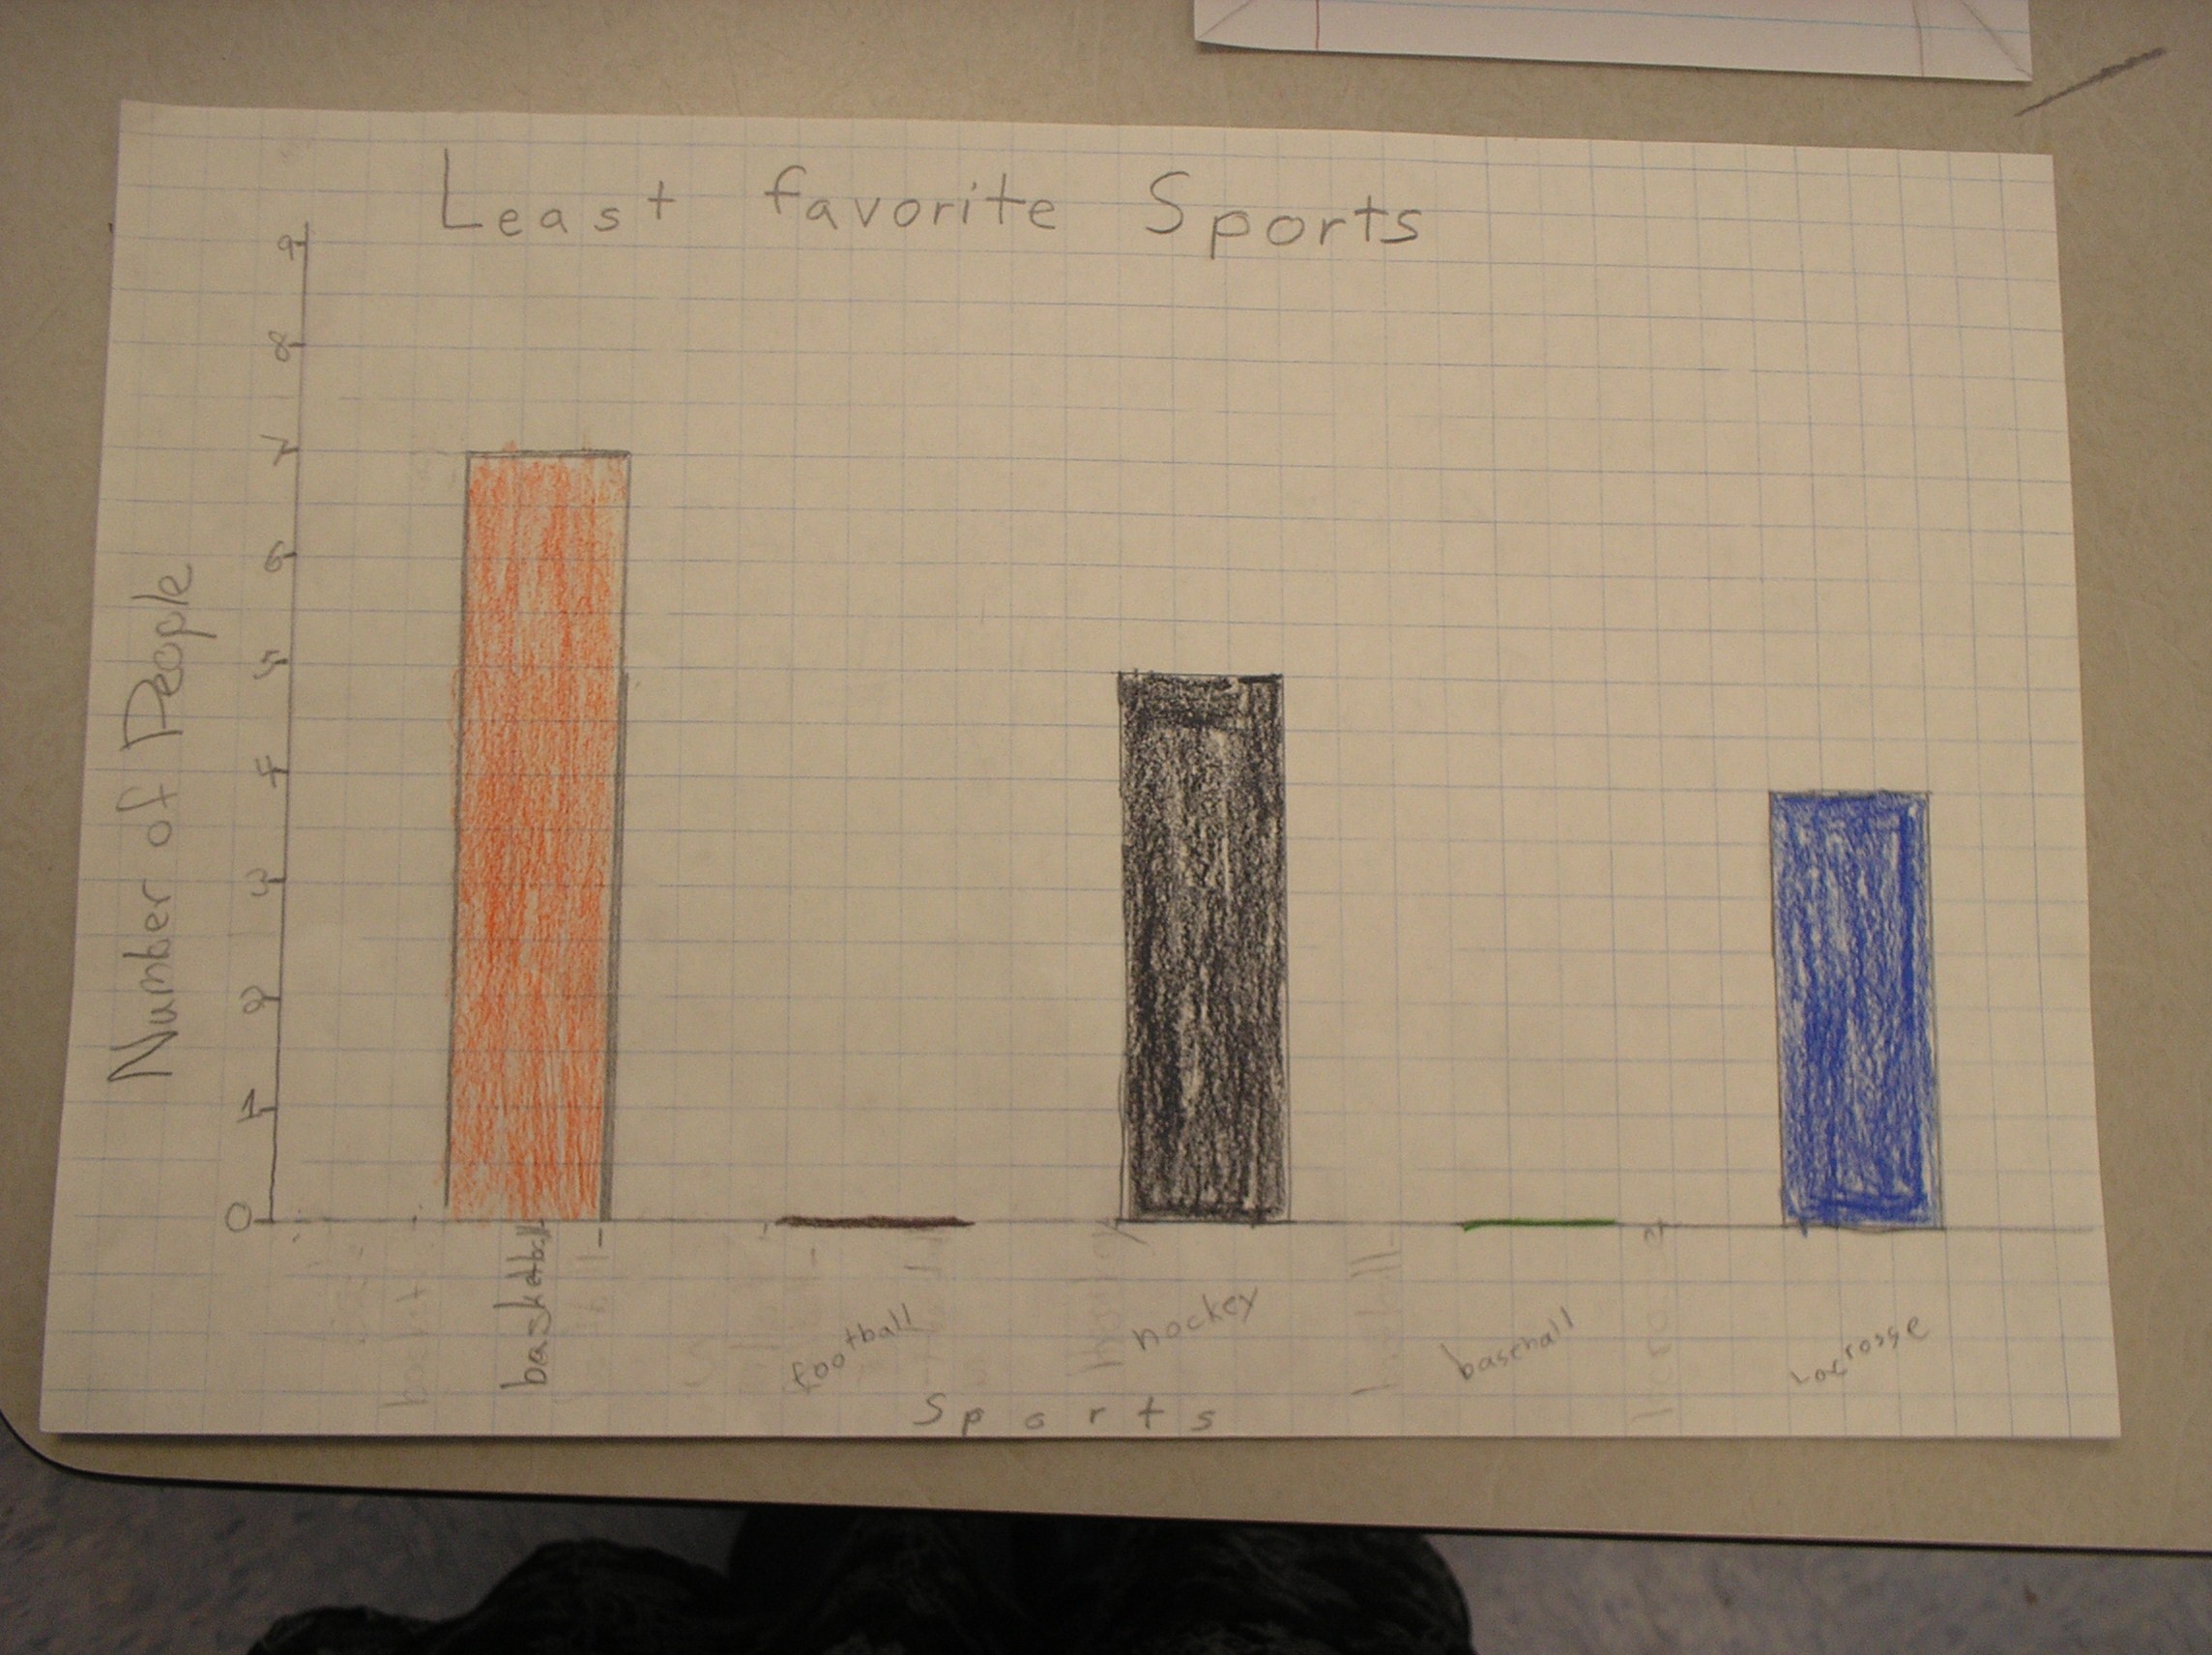
Student Work
survey
survey results
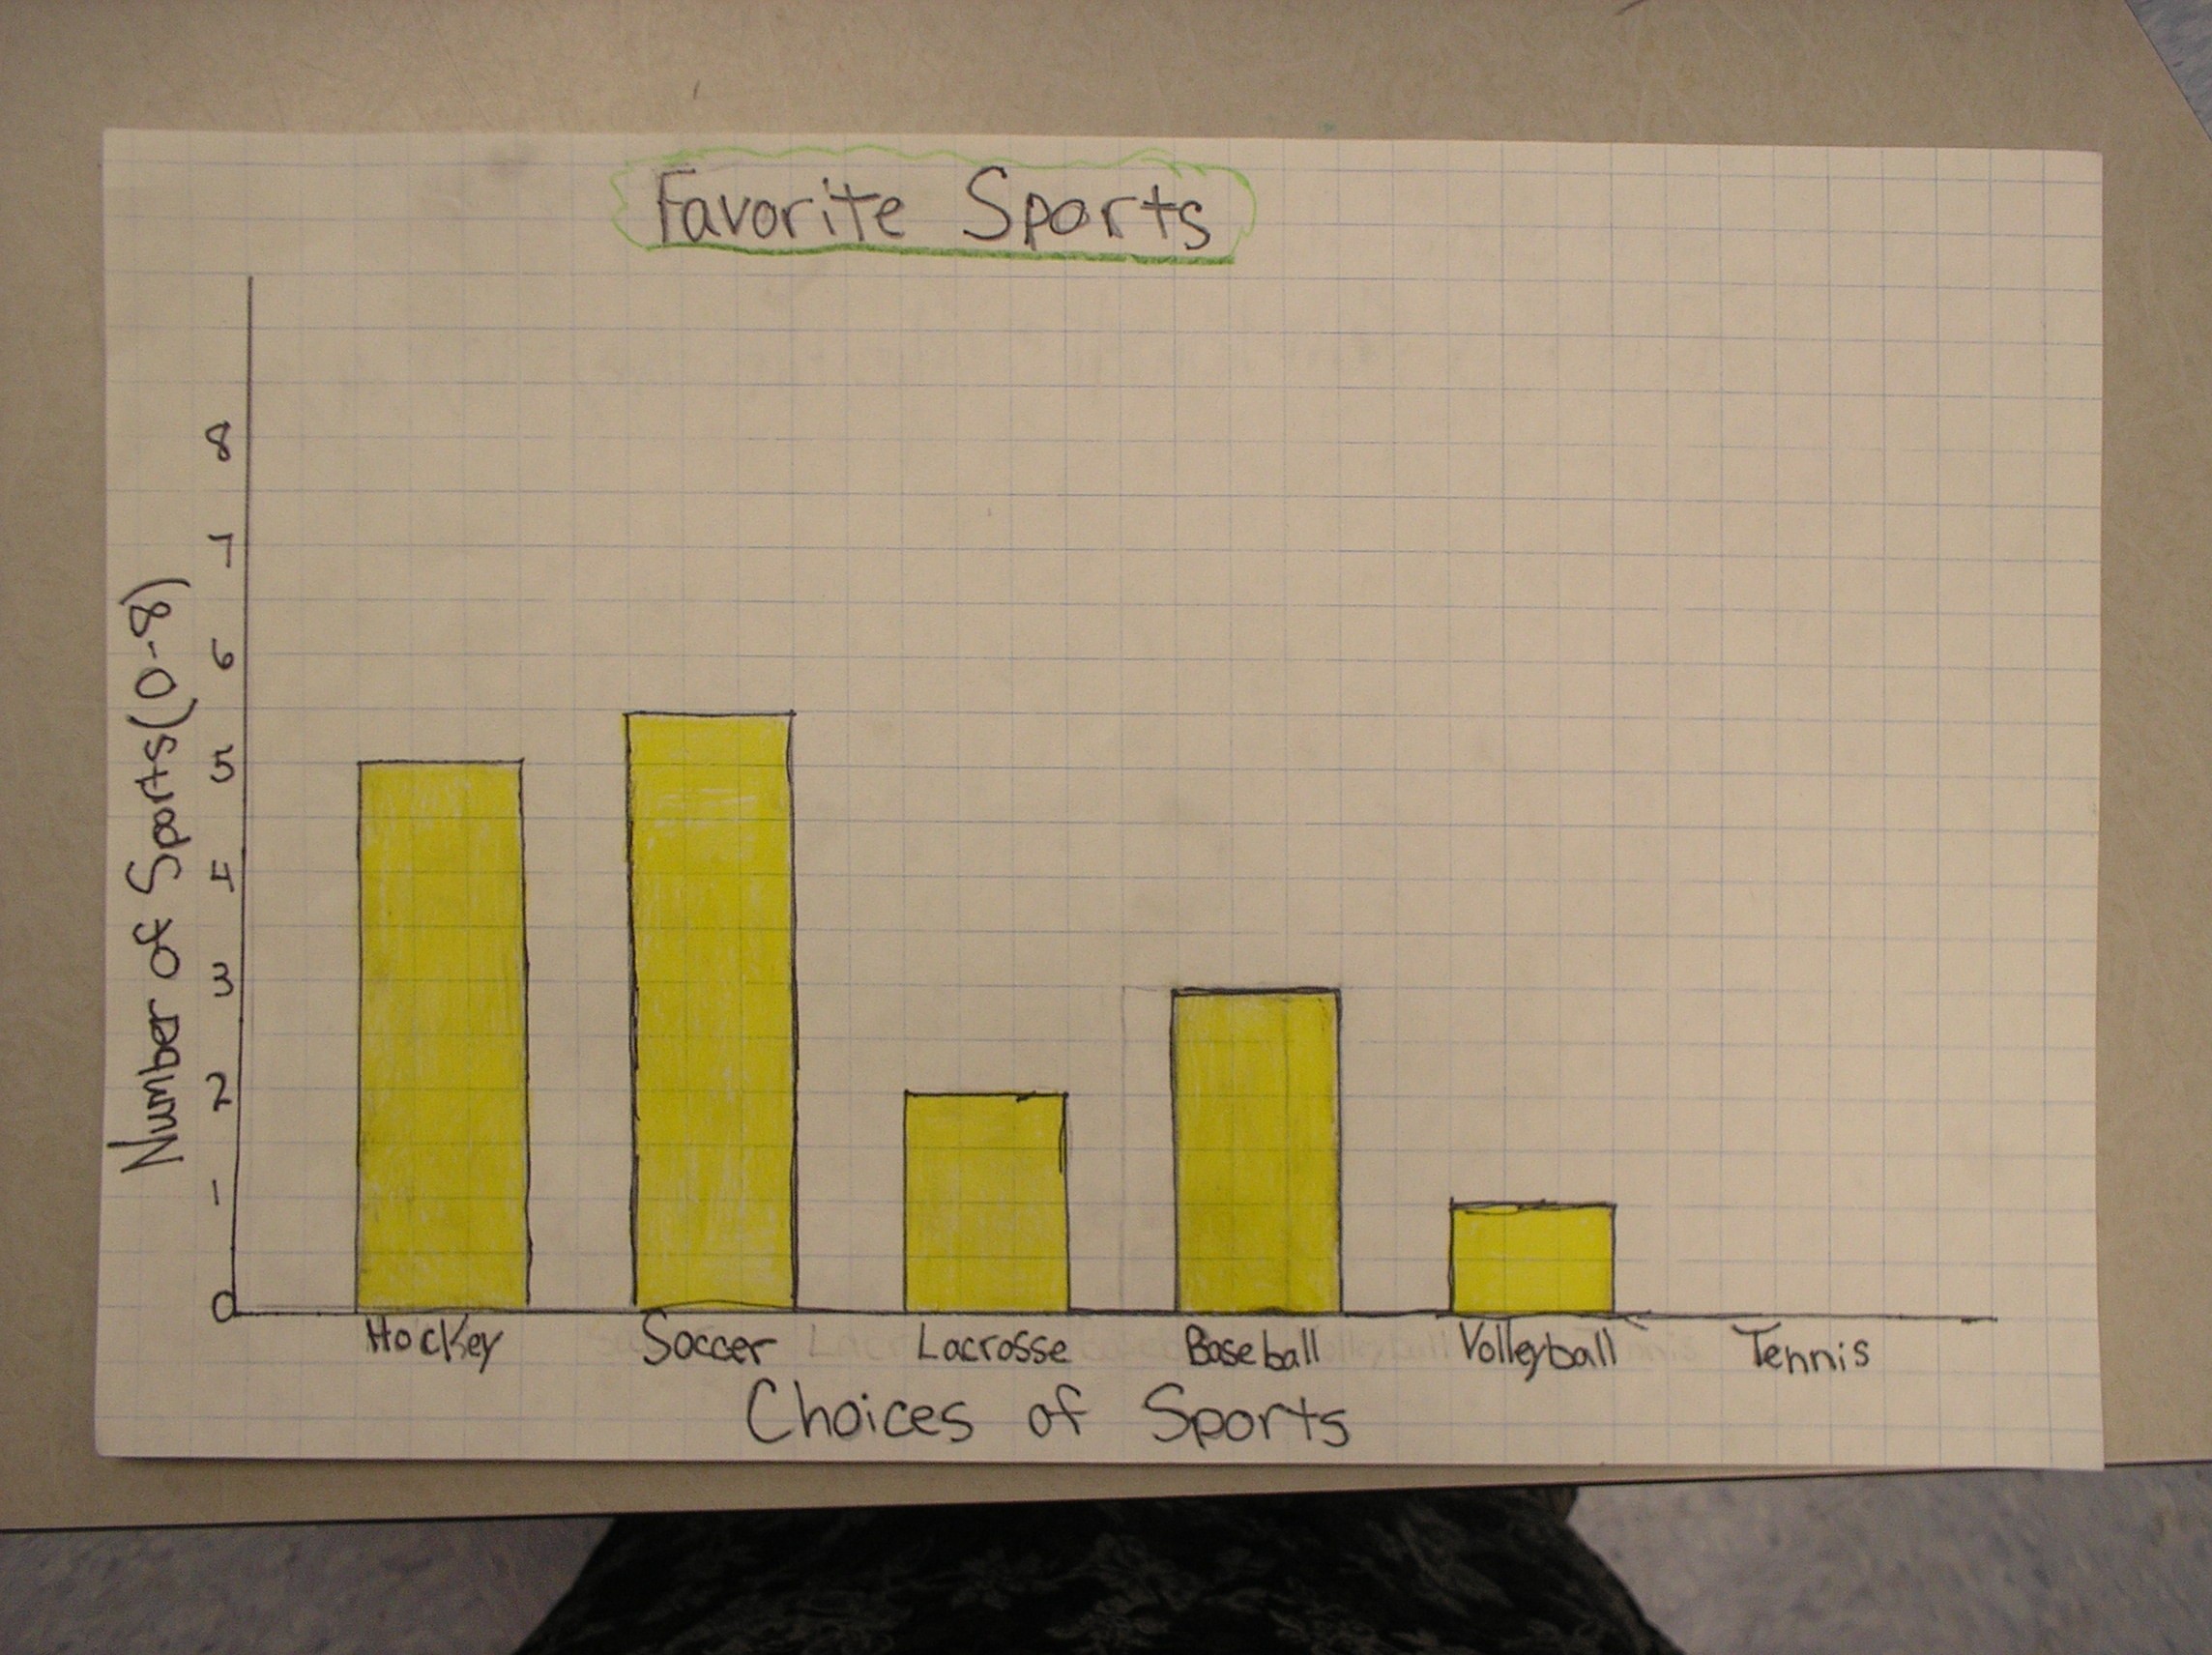
paper graph
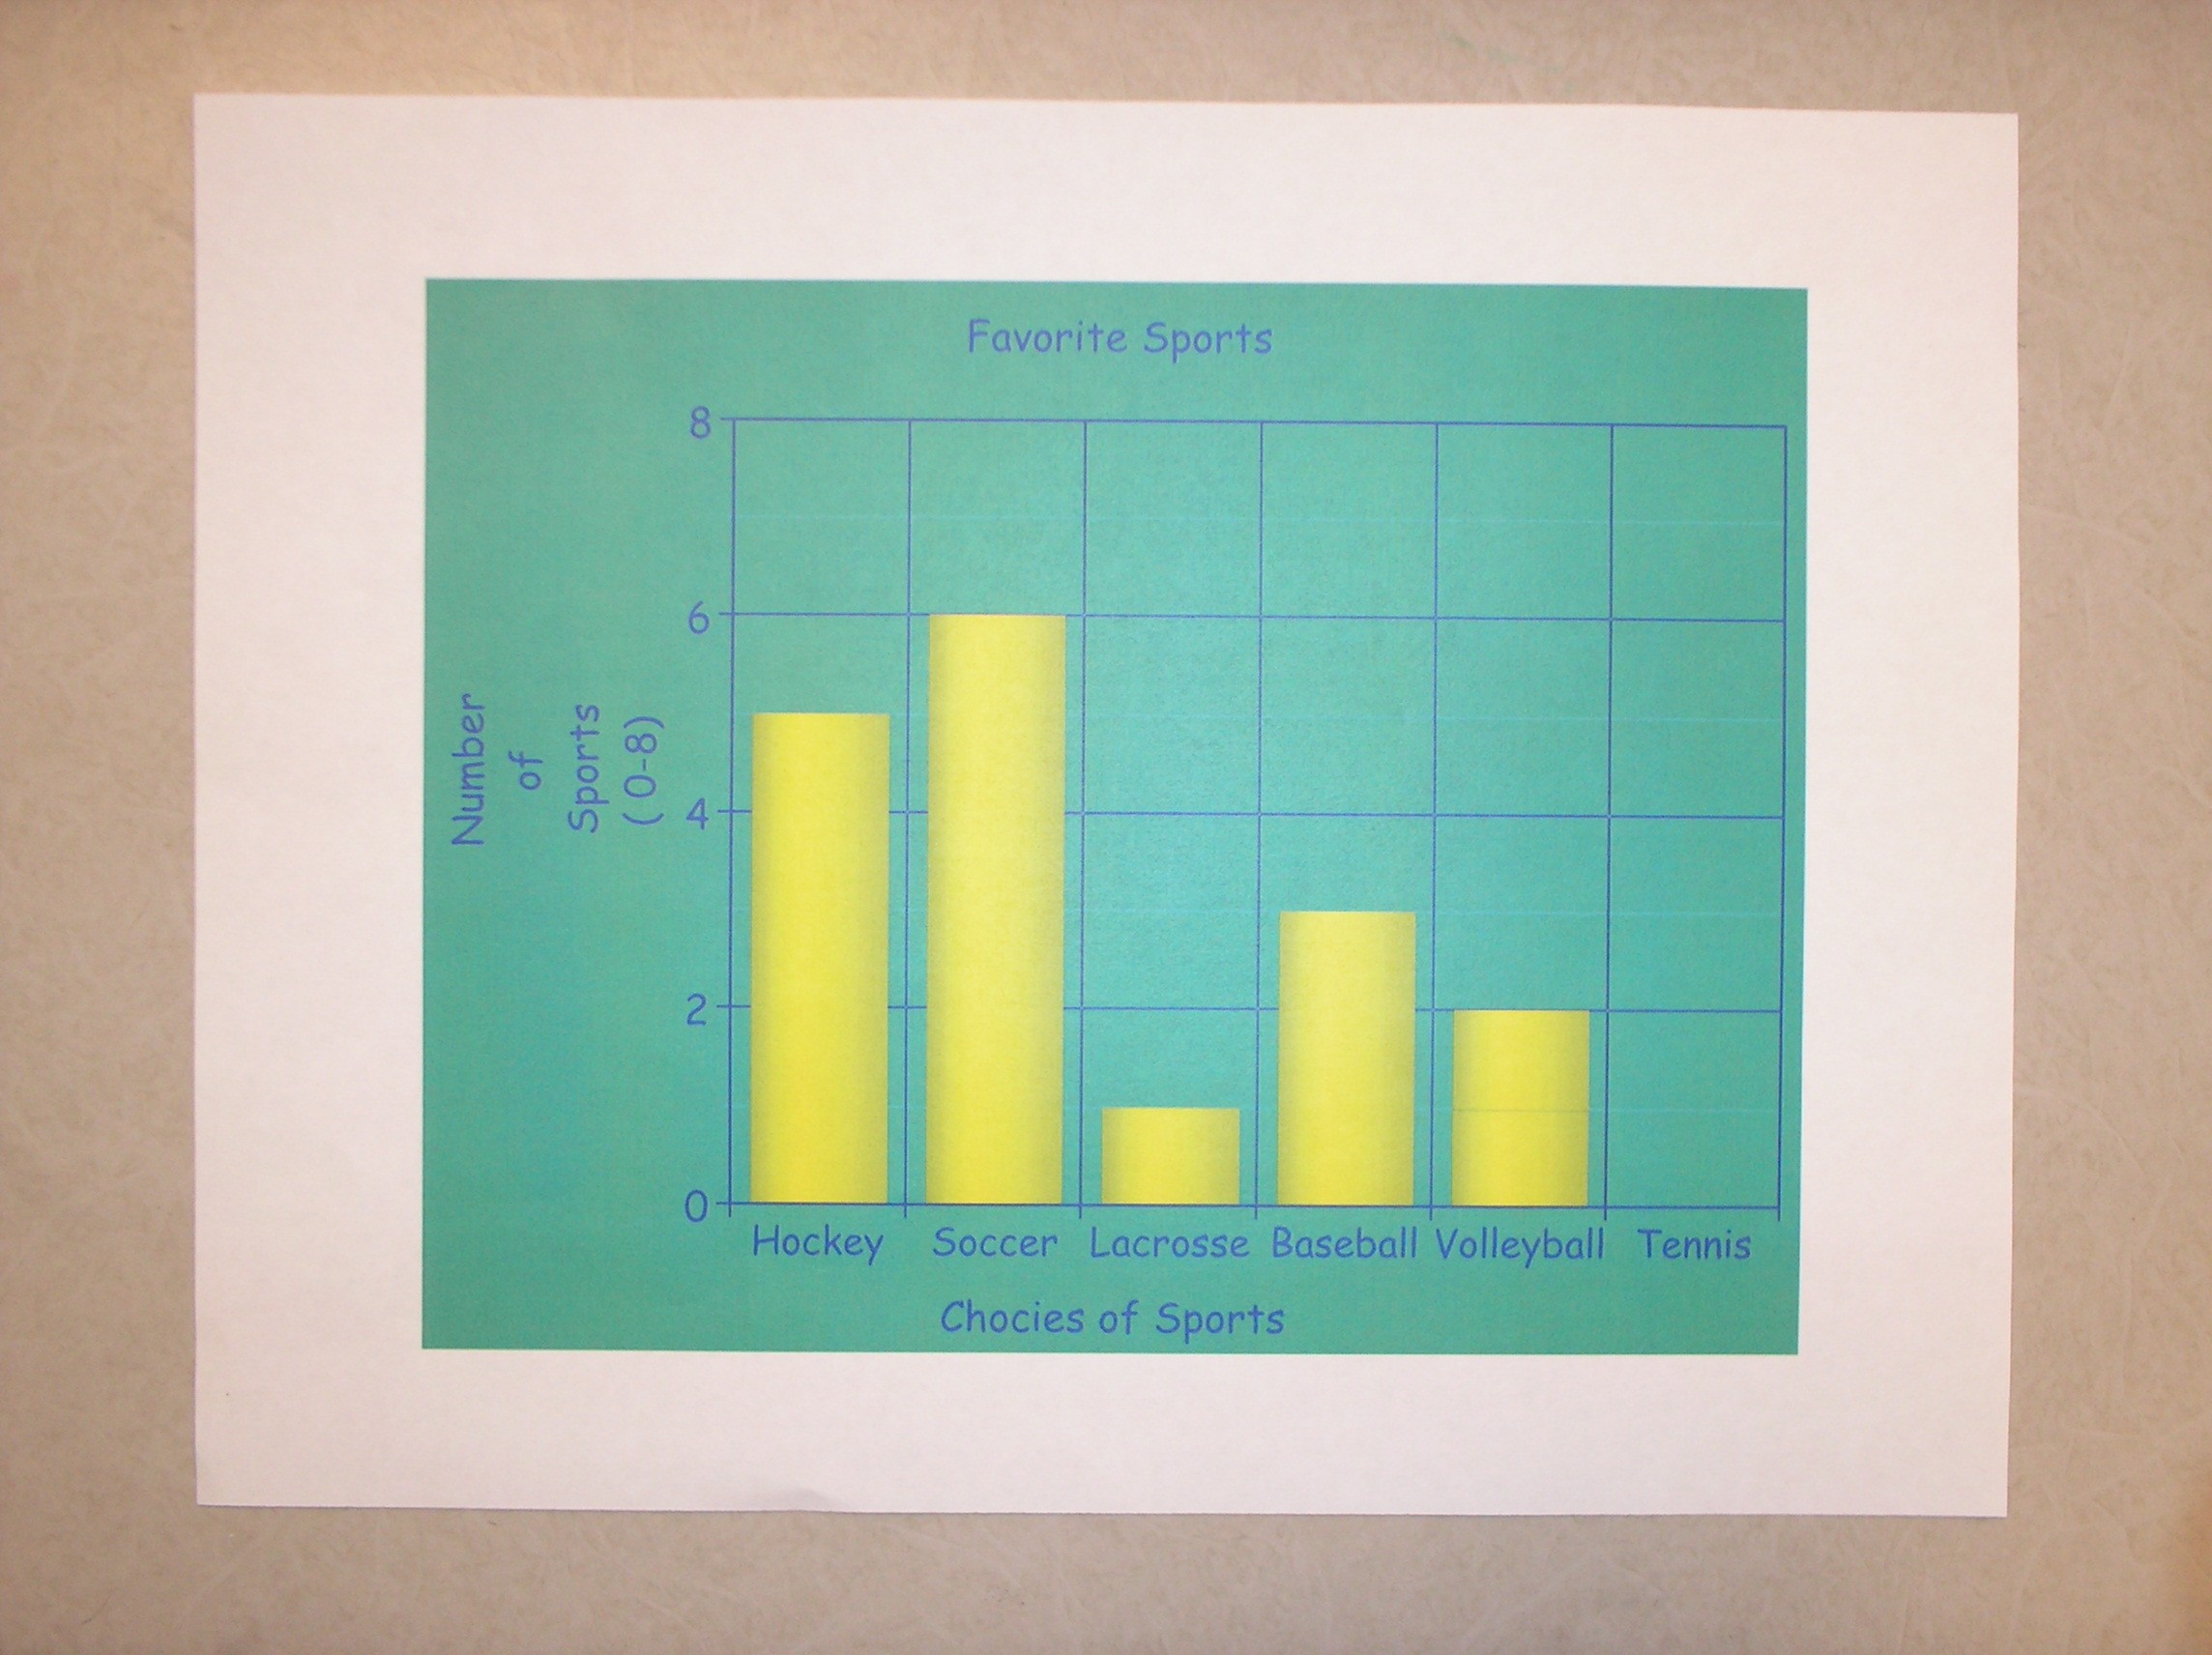
computer generated graphs
*see attached samples below


Related Resources
Day 1: "bar graphs" SMART Notebook file (attached)
Day 2: Project Direction Sheet (graphing project.pdf -attached)
Day 3: none
Day 4 LCD projector & internet access
Day 5 & 6:each team needs access to a computer with internet
Day 7: carousel activity and partner rubrics (see attached partner rubric.pdf)
Website(s)
NCES Create A Graph
Key Vocabulary
bar graph,frequency table, horizontal,vertical, scale

