Learning Experience/Unit
Measuring Cells Under the Microscope by St. Lawrence-Lewis BOCES
Subject
Math, Science & Technology
Grade Levels
Intermediate, 7th Grade
Assessment
The students will be assessed on their ability to correctly use a microscope and on their ability to correctly measure cells. They will also be assessed on their ability to create a data chart and graph using Excel.
Learning Context/ Introduction
A part of the Middle School Science program focuses on the students' ability to know the parts of a microscope and the various uses of different types of microscopes. The focus of this lesson is to enable students to successfully use microscopes to view cells and to enable students to measure various cells under the microscope. Once students have measured various cells, they will plot the information into an Excel Spreadsheet and formulate a graph based in the information. The students will be using Excel under the direct supervision of the teacher to create a data chart and a graph. Students will need the previous knowledge of how to create a bar graph on Excel and how to measure a cell under the microscope.
Duration
Each class period is 42-minutes. All three days will use the full 42 minutes
Essential Question
How can we use Excel to create a bar graph of the size of different cells?
Instructional/Environment Modifications
A completed graph and data chart will be accessible to Special Education students so that they have a guide to work from. There will be a Consultant or Resource Room Teacher in the computer lab to assist those students who need some extra help. Special Education students will also be given extended time to complete the graph and data chart.
cell size instructions.doc
Procedure
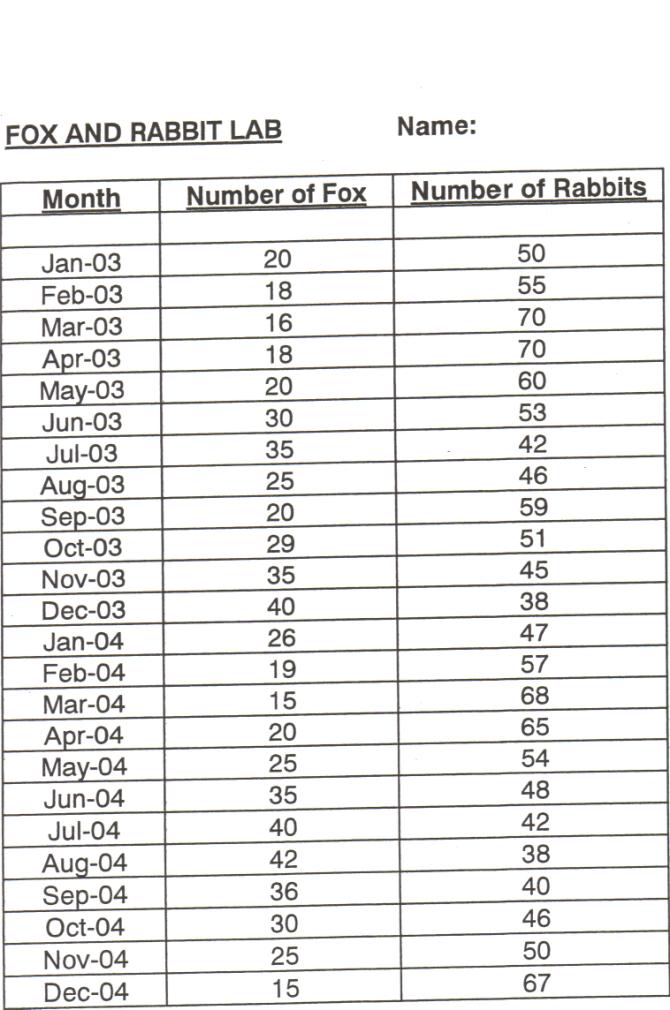
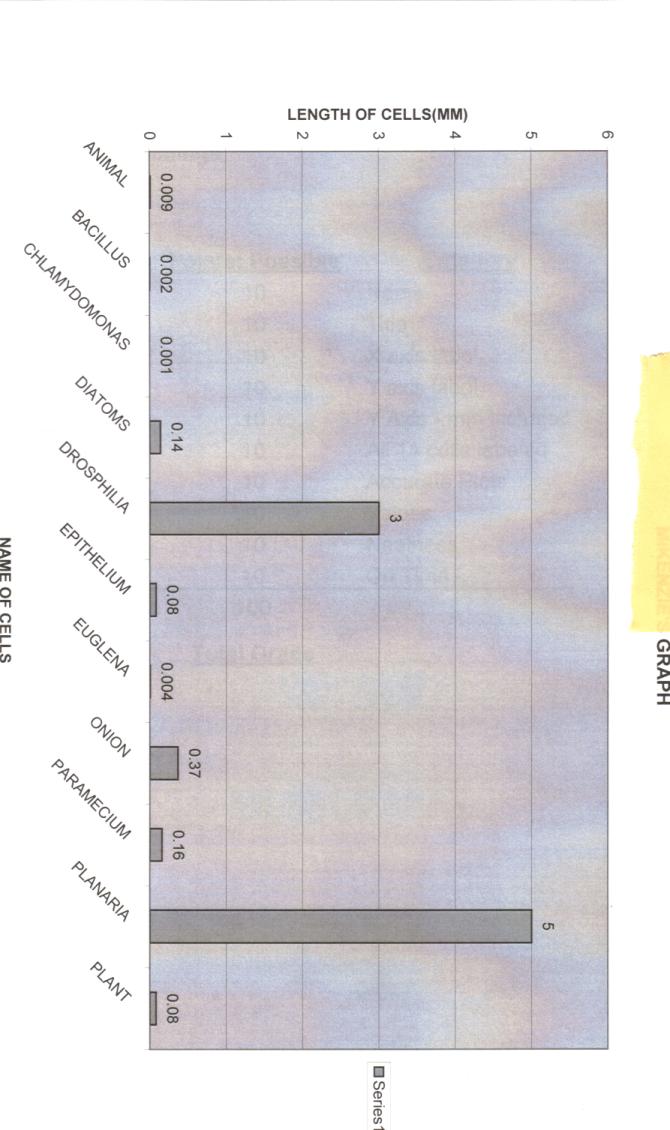
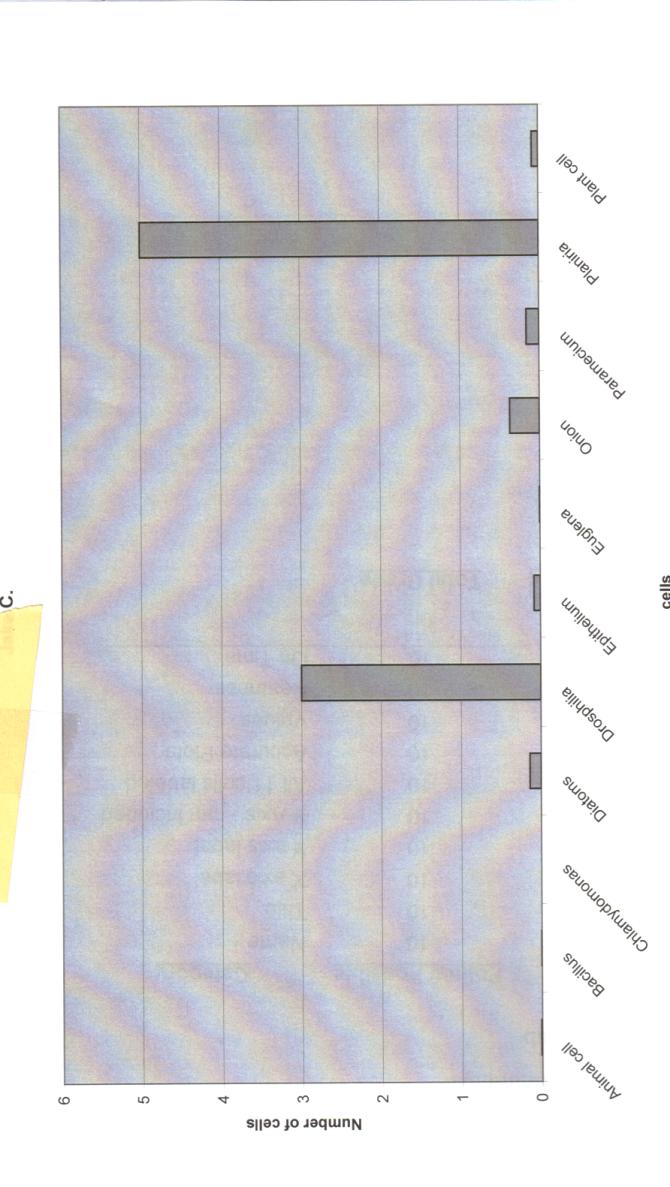
- Day 1: Class will be conducted in the Science room. Students will retrieve their microscope from the previous day. They will each receive 10 different prepared slides containing the following cells : (diatoms, onion, paramecium, etc). Each student will work with a partner to bring the cell into focus under the microscope; however, each student will need to fill in their own information about the cell in the data chart provided. Each student will need to label the name of the cell, the size and color of the cell.
- ·Day 2: Class will be conducted in the classroom. The class will begin with a 5-minute check of the data sheets. The students will work with a partner for the rest of the class period to finish their data.
- ·Day 3: Class will be conducted in the computer lab. Students will use Excel to create a data chart based on their information from Day 1and 2. Once they have created the data chart they will create a bar graph. Student who finish the bar graph early may work on creating a line graph based on the information provided on the worksheet labeled "line graph information".
- Cell Size Data Chart
- Cell Size Data.xls
- cell.doc
- Cell scope lab.doc
Reflections and Feedback
Due to the number of students in the computer lab, I would highly suggest having an extra person to help students with the graphing. The students really enjoyed using the microscope and using Excel to create the graph. The previous week students had been creating graphs through the tradition pencil and graph paper method.
Student Work
High, Medium, and Low Samples are provided

Related Resource
Computer Lab, Resource Teacher

