Learning Experience/Unit
Acceleration Due to Gravity by St. Lawrence-Lewis BOCES
Subject
Math, Science & Technology
Assessment
Students will use Microsoft Excel to graph their data and determine the slope of the best fit line. Their data was gathered from a 200-gram weight that was attached to a sparker tape. They will then take the slope (which equals the acceleration due to gravity) and convert the units into meters per second squared. Then the student will calculate the percent error of the experimental data compared to the standard acceleration due to gravity, which is 9.81 meters per second squared.
Learning Context/ Introduction
Students will use a spark timer to record the position verses time of a free falling mass. By knowing the frequency the spark timer was set on and measuring the distance between the dots, the student will be able to calculate the speed of the mass and determine the acceleration due to gravity.
Duration
From start to finish this took four complete lab periods. Lab students meet two out of six school days.
Essential Question
How did someone decide that acceleration due to gravity was 9.81 meters per second squared?
Instructional/Environment Modifications
A carbon paper ticker tape timer could have used instead of a sparker timer.
There was time at the end of the school day from 2:30 pm to 3:35 pm most days in case a student needed to make up any missed worked.
Procedure
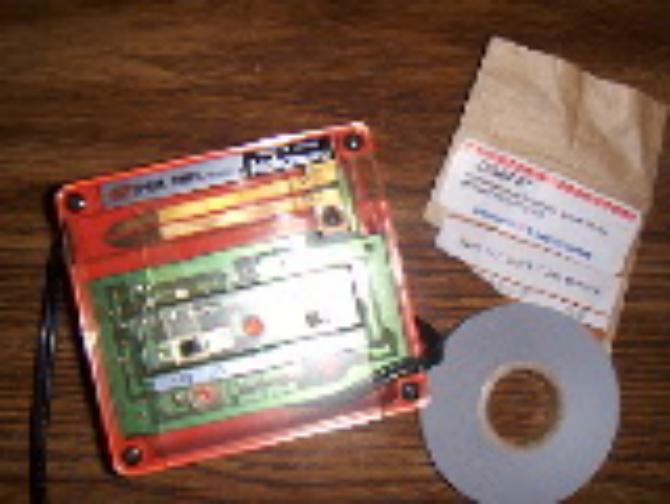
Day One: The students learned the definition of a Hertz and how to determine the time between dots on a sparker timer.The students also had to learn how to set up and use a sparker timer.The safety issue of a falling mass was discussed with everyone in the room and goggles were worn.Then the students took a rough measurement from the floor to a person's shoulder while a student was standing on a step stool.Then the student put the silver colored sparker taper through the sparker.The starting end of the tape will have clear tape on it (placed by a student) to make a loop to help support the mass without ripping the sparker paper.The sparker timer is set at certain Hertz (in our case 10 Hz) and turned on!The mass is let go from a resting position near the student's shoulder who was standing on the stool and holding the sparker timer vertically.The reason for the vertical placement of the timer was to help reduce friction of the paper on the timer.Since I have only two set ups and each student needed run their own sparker paper thought the machine this took all period.
Day Two and Three: Students went to the library computer lab with their sparker papers and metric rulers. There I passed out the set of instructions and rubrics on how to open the "Acceleration due to gravity Excel template" (which was located on the school's intranet system) and how to enter their data.The students also had to graph their data and apply the best fit line to the data.The students' instructions also showed them how to have the equation y=mx+b show up on their graph.The m equals the slope of the line.At the end of the instructions, the students were asked three questions which they were to answer on that sheet and turn in to me. Students had to save their work to the "Classworks" (the school’s intranet) folder and print out their data table and graph.
Day Four:Students presented their findings to their fellow classmates.A discussion followed of how scientist came up with the number 9.81 meters per second squared for acceleration due to gravity and how close their experimental data came to the above number and factors that may have effected their results.
Reflections and Feedback
In the past, the students did this lab had graphed their data by hand and always had great success. This time I included that the students work with Microsoft Excel in hopes that this would give them a better understanding of how computers may impact their college science classes. Little did I know how little I knew about Microsoft Excel myself. Next time I have the students complete this lab, I am hoping it only takes two and a half or three days only. This year, extra time was needed because I did not know how to properly make a graph and best fit line in Microsoft Excel. If it was not for the fact that I had to include the technology standard as part of my participation with this grant (my school rule) I would have given up on Excel. However, I am glad I solved the problem between the line graph and the xy scatter graph because the students enjoyed this lab and were proud of their work.
Student Work
The following are links to examples of student work:
Related Resource
New York State Rubistar website for making rubrics.
Resource/Materials
Acceleration due to gravity excel template

