Learning Experience/Unit
Probability Experiment Simulation: Design and Data Analysis Using a Graphing Calculator by The Shodor Foundation
Subject
Math, Science & Technology
Grade Levels
Intermediate, 7th Grade
Assessment
Intermediate Assessment:
- Observation on guided notes
- Homework assignments
Assessment:
Students will be given a problem in which they will:
- Design a simulation for a spinner
- Write down their data
- Draw and complete a frequency table to organize the data
- Determine the experimental probabilities
- Make comparisons to the theoretical probabilities and draw conclusions
Learning Context/ Introduction
Students will use a graphing calculator to simulate probability experiments. Each student will design, conduct, and draw conclusions from simulations of probability experiments.
Purpose of the learning experience:
Students will become familiar with using the graphing calculator to run simulations of probability experiments. After running several guided activities, the students will design and conduct simulations representing real life applications.
They will construct frequency tables to organize the data. After collecting and organizing the data, the students will compare the experimental data to theoretical data and draw conclusions.
Through these activities the student will be able to:
- Use a graphing calculator to simulate a probability experiment
- Calculate experimental probabilities
- Design simulations to determine probability
- Draw conclusions about the results of the experiment
Prior Knowledge: What students need to know
A basic understanding of theoretical probability.
Materials:
Graphing calculator
Duration
Each class period is 40 minutes
Total time is anywhere from 3 – 5 days
Essential Question
Where could simulations be used in the real world? How close to theoretical probabilities are experimental probabilities?
Instructional/Environment Modifications
Students are in groups of 4 and work together even though they have different data. Each student has his own graphing calculator to work with provided by the school.
Procedure
Day 1 - 2:
- The teacher will guide the students through a simulation of rolling a die 50 times on the graphing calculator as a large group activity. A graphing calculator viewer was used so that the students could see what came up on the screen and the steps needed to set up the simulation. I also had a picture of the face of the graphing calculator on the smart board so that I could point out where the keys were that were needed (Activity 1). There is a short interactive computer activity that could be used to demonstrate how to fill out a frequency table. The topics covered will be:
- How to use the random integer generator on a graphing calculator to run a simulation
- How to create and use a frequency table
- Finding the experimental probabilities from the data
- Comparing the experimental probabilities to the theoretical probabilities
- The students will then repeat the simulation on their own and collect a second set of data.
Day 2 - 3:
- Students will run a simulation of rolling a die more than 60 times. They will then collect the data, and construct and complete a frequency table. The students do the same activities as was done in the group activity for homework.
- The second part of the homework involves explaining how to set up a simulation on the graphing calculator for a coin toss.
Day 3-4 Assessment
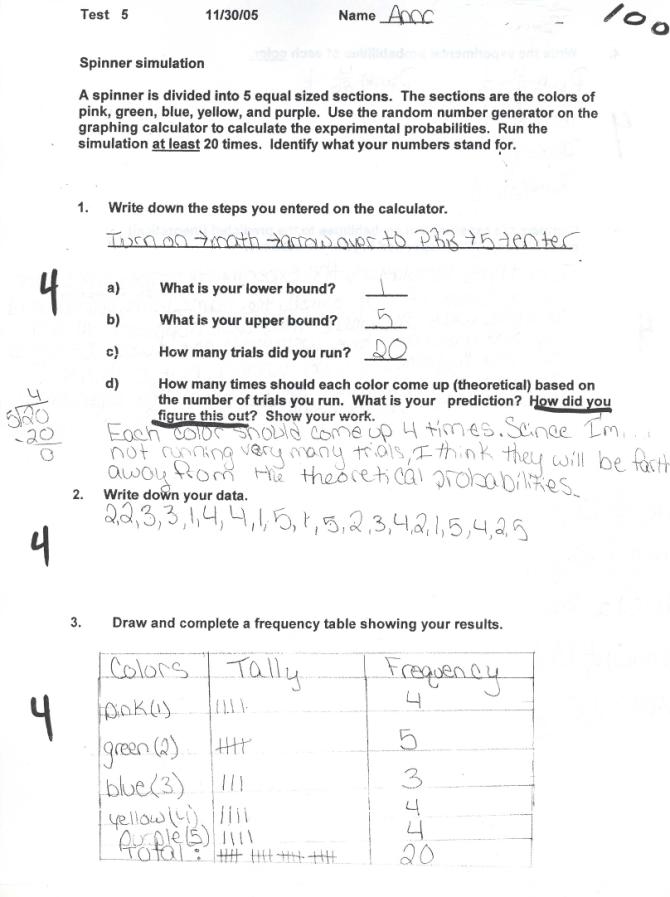
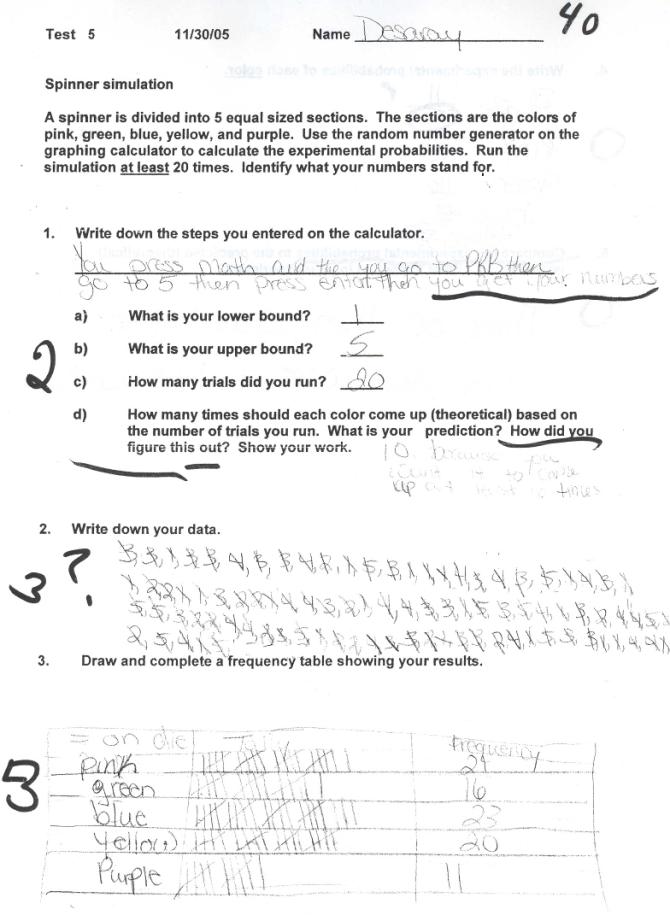
- Students will be given a problem where they will:
- Design the simulation, conduct the simulation on a graphing calculator, collect the data , and organize the data
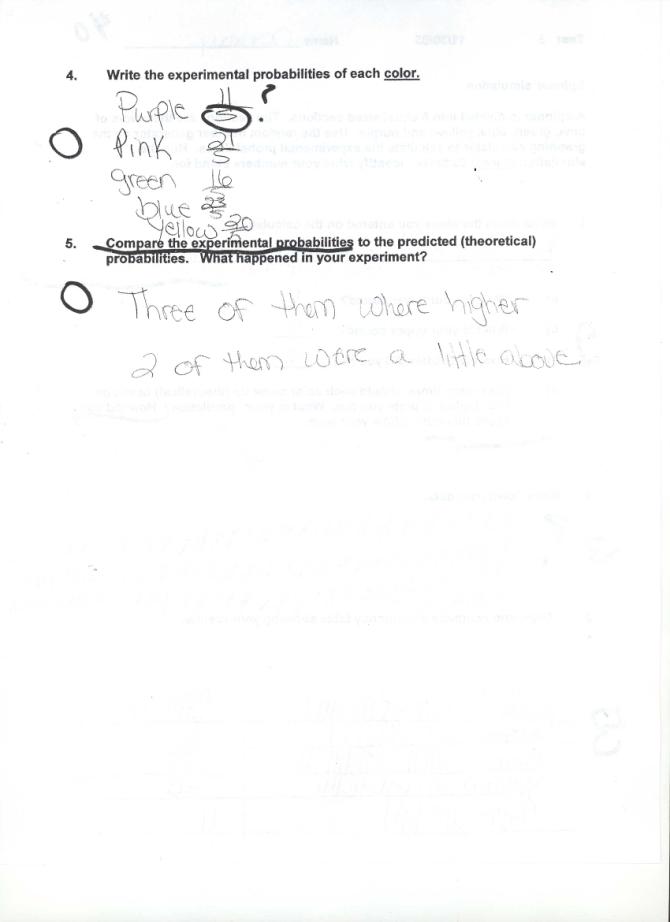
- Find the experimental probabilities and compare the experimental probabilities to the theoretical probabilities
- As a wrap up of the learning experience the essential question is addressed with two computer simulations and a discussion of other cases where simulations are used everyday such as weather forecasting. In the first computer simulation, the students view a forest management simulation of how the population of rabbits and wolves progresses over time. The second is a simulation of how a forest fire progresses based on probability and starting position.
- Assignment Sheet
Reflections and Feedback
This is the first time I have taught this lesson. I found the students were engaged and interested in the activity. Next time I would give a little background on theoretical probability and experimental probability. I suggest that a graphing calculator viewer be used the first day so that all students can see how to enter the steps required on the graphing calculator. Interactive graphing calculator software would be even better for enhancing teaching the use of the graphing calculator.
Student Work


Related Resource

