Learning Context/ Introduction
Purpose and Curricular Connections
This Learning Experience was introduced in an 8th grade science class with the statement …"length of day is a cyclic change." From that statement discussion followed where many ideas and questions were shared by the class and recorded. From this introduction, our students carried out a coordinated investigation in math and science of the changing patterns of the length of day from a global perspective. (Note: The Learning Experience could be used in 9th grade Math or Earth Science.)
Why was this activity developed?
- We wanted students to experience real–life multi-step tasks that would encourage critical thinking and analysis
- We wanted to help students expand their reasoning and make a connection between mathematics, science, and other disciplines
- We wanted the students to experience the power in technology as a tool for analyzing data
This activity fits school and course curriculum as follows:
Earth Science Curriculum
- Effects of earth revolution on seasons
- Effects of earth rotation and revolution on duration of insolation
- Cyclic changes in climate and in energy distribution on the surface of the Earth
Prior Knowledge:
- Students would have a higher learning curve for instructional technology if they had no background in spreadsheets. (See Reflection)
- How to use a spreadsheet
- How to plot and interpret graphs
- Understand properties of the earth's revolution around the sun
- Understand cycles, patterns, maximum, minimum range, and elements of symmetry
Procedure
What Teachers Do
- Introduce the Learning Experience in both the math and science classes. (Both teachers shared these students.) Review the Vocabulary handout or assign it as homework prior to the activity
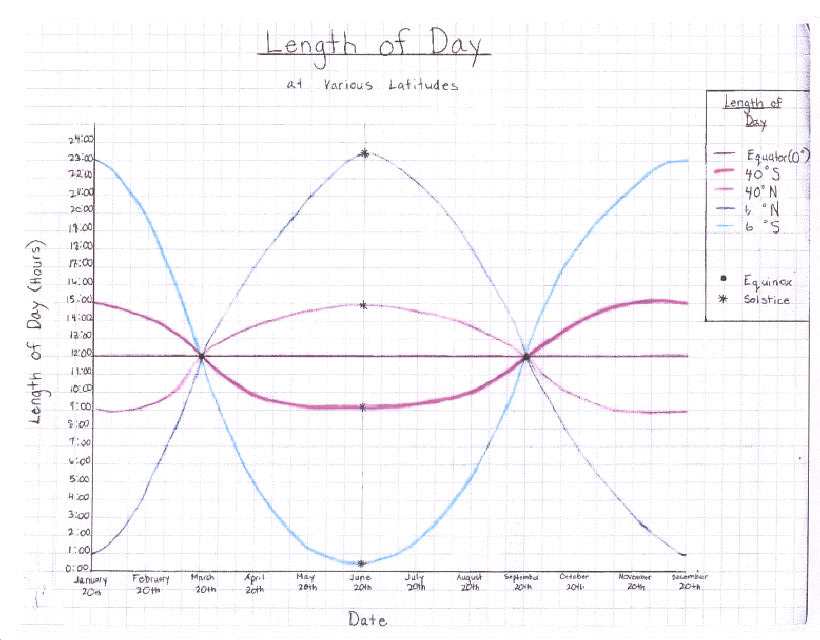
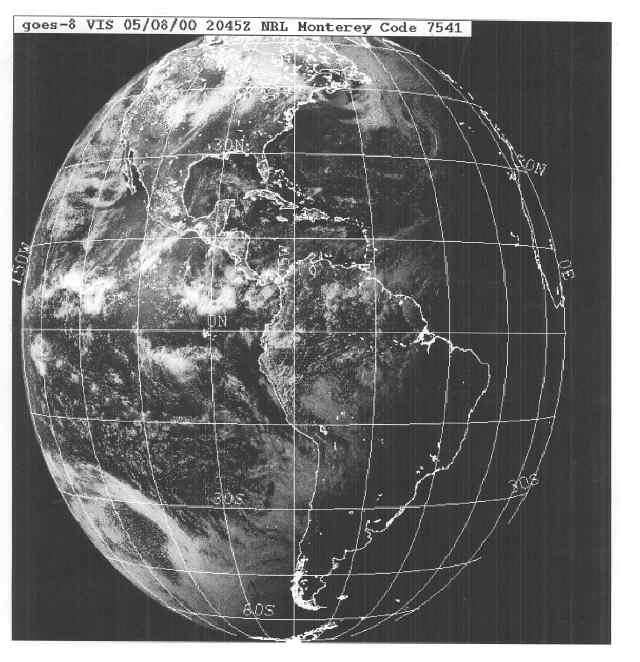
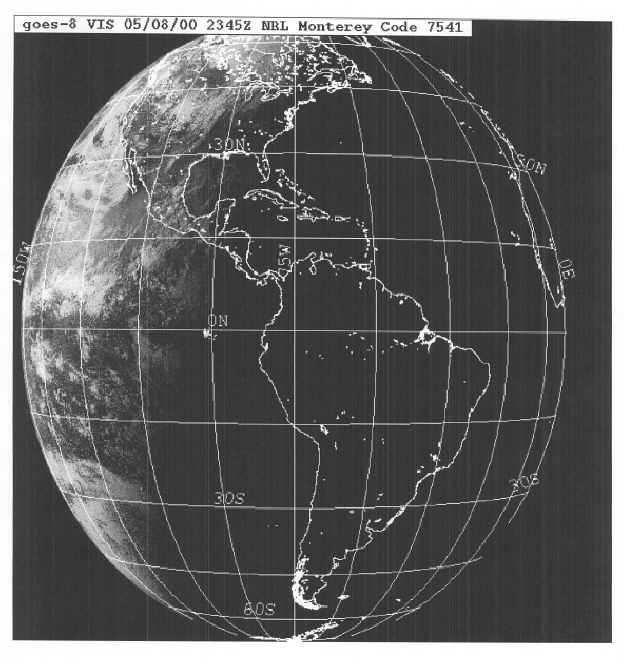
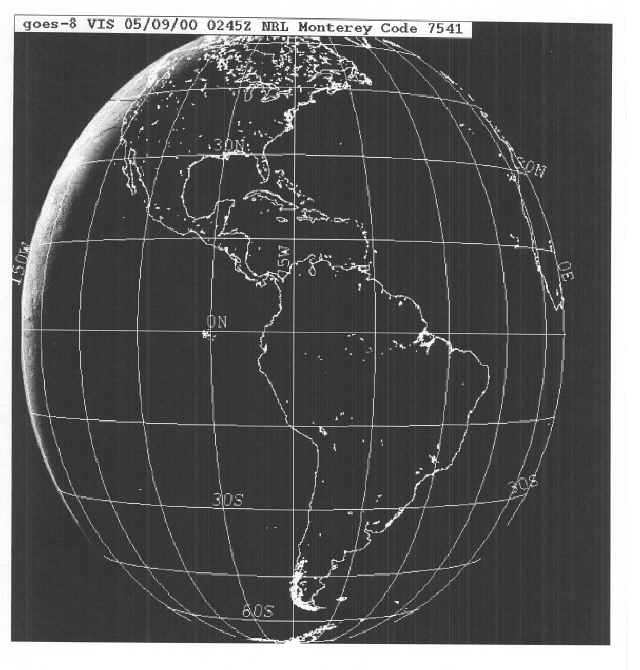
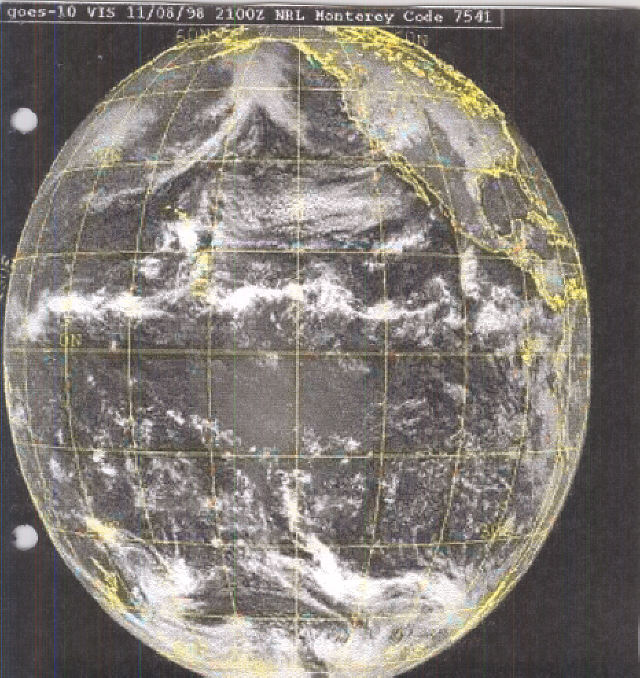
- Introduce the statement "Length of day is a cyclic change". Discuss the Length of Day handout, the Satellite Photos, and the Sample Spreadsheets (See Additional Handouts under Resources.)
- Conduct a Length of Day Symposium, using the symposium outline below
Length of Day Symposium
Describe Patterns
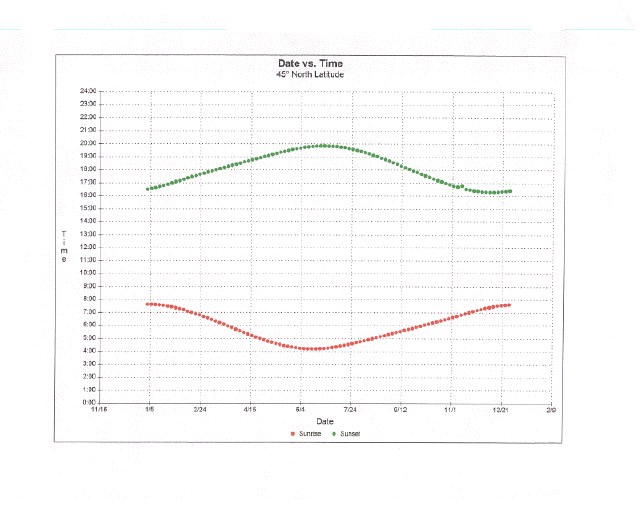
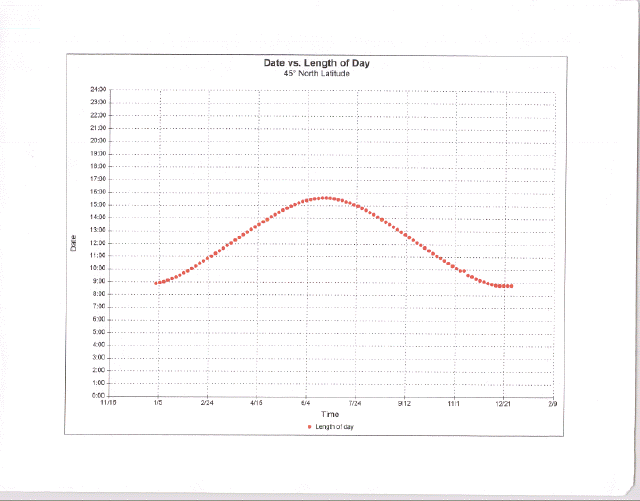
Show graphs from different latitudes in both the Northern and Southern Hemispheres.
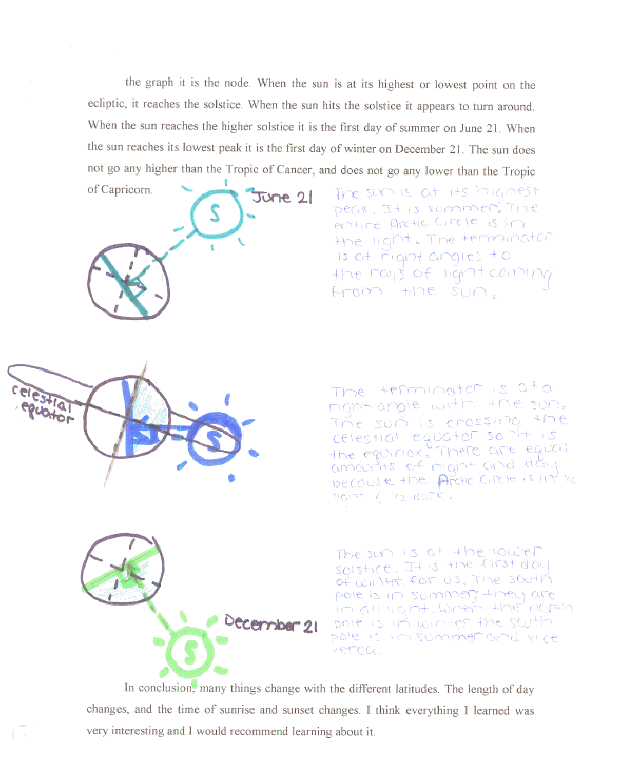
- Include vocabulary words: inverse, transformation, equator, ecliptic, rotation, latitude, symmetric, tropics (Cancer, Capricorn), nodes, range, equinox, mirror image
- Include points of intersection. Compare different hemispheres
- Start with Sunrise/set overheads showing patterns
- Then, show length of day using same latitudes
Demonstration using Globe and Light
- Discuss terminator, rotation with relation to the sun
- Discuss ecliptic, 23º, tropics, solstice, equinox
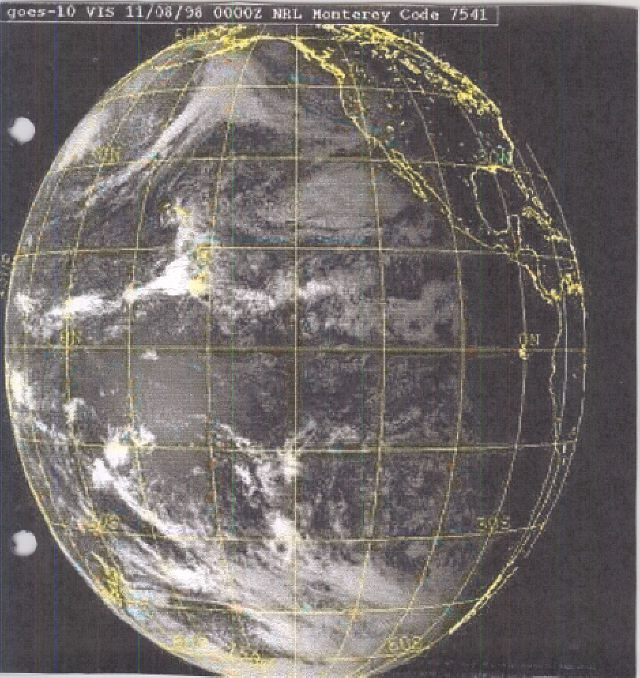
Satellite Photo
Discuss the world map
- Discuss the relationship to climate, seasons, and types of vegetation due to the sun's position
Biological clocks
Autumn leaves – based on length of day
Flowering
- Short day flower (forest)
- Long day flowers (prairie)
Animal-Hibernation-fur changes migration time
Pattern for Dinosaur distributes
- Autumn: warm but the polar areas still had long periods of darkness
- Dinosaurs probably migrated to get to areas of more daylight- end line of migration of polar dinosaurs
Growing Seasons- plants need a certain amount of time to grow.
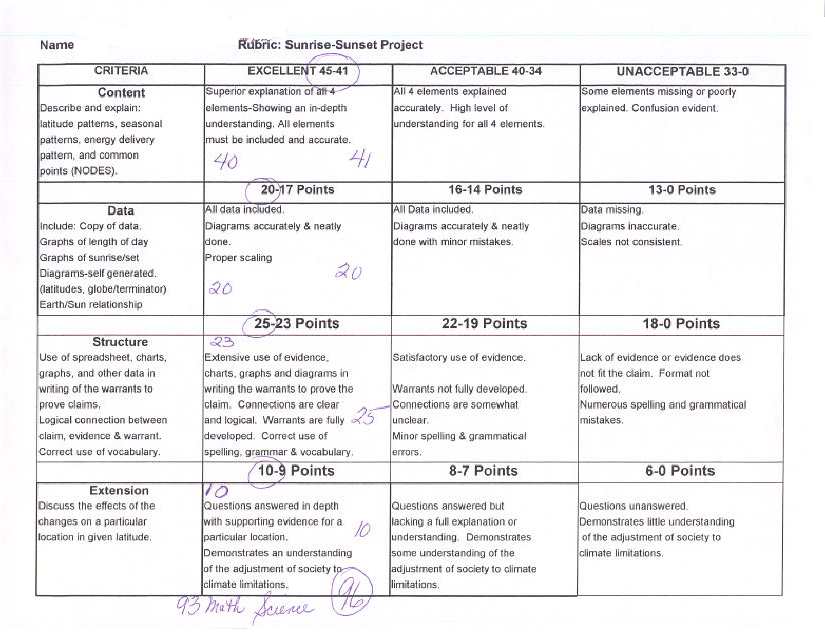
Introduce the report-writing assignment and the Rubric of the Sunrise-Sunset Project.
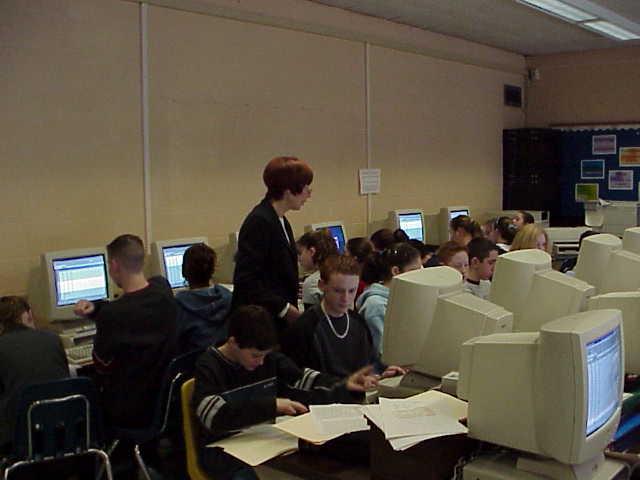
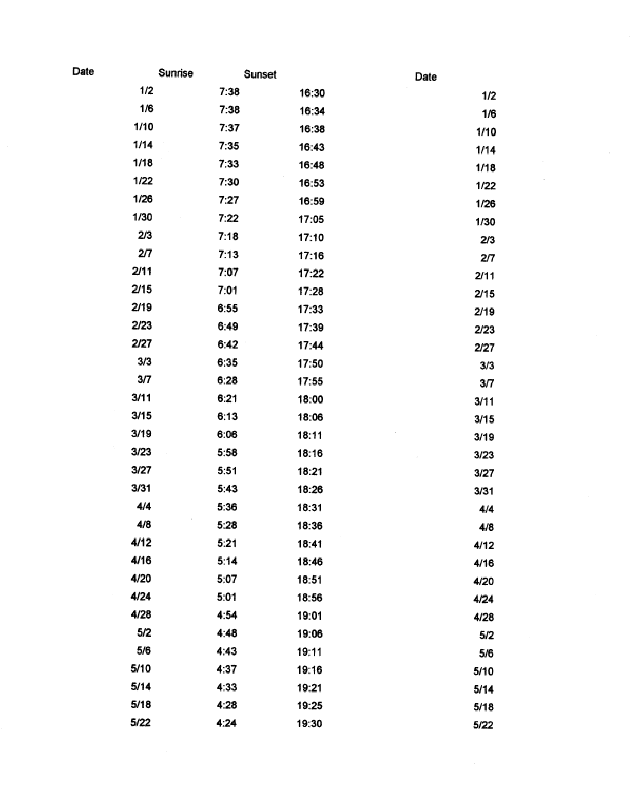
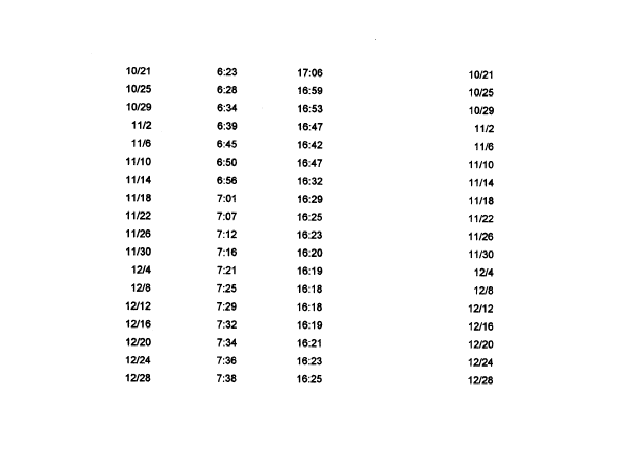
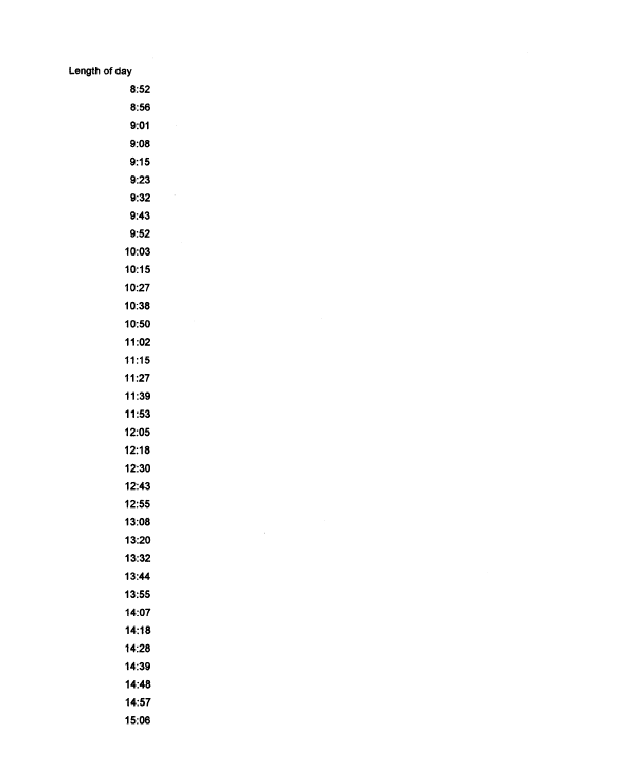
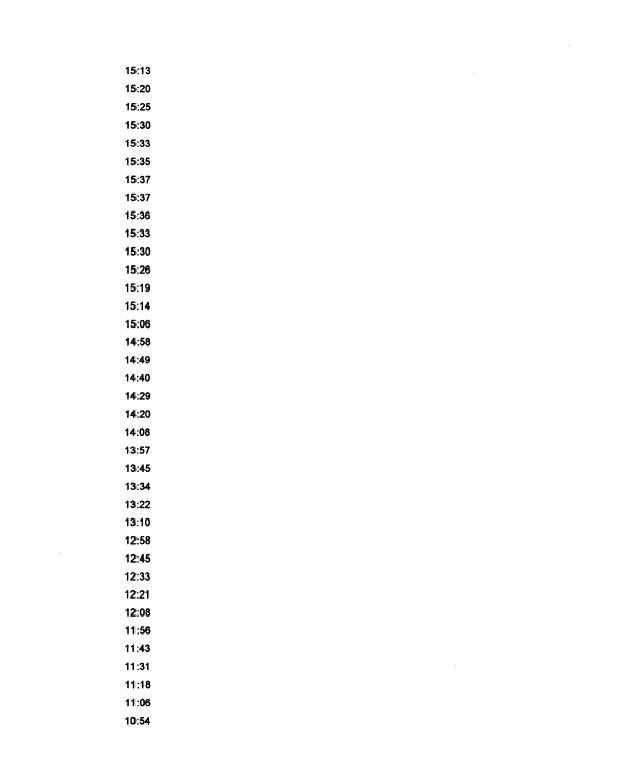
Divide students into teams of 2 or 3 and assign each group a specific latitude and the Sunrise Sunset Length of Day handout. In math class, the teams organize their data on spreadsheets and graphs, using the Spreadsheet Information handout, Sample Graph, making copies of results to be shared with the other teams.
- In math class, share the graphs, analyzing them for patterns, symmetries and cycles. Ask students to make predictions using the graphs.
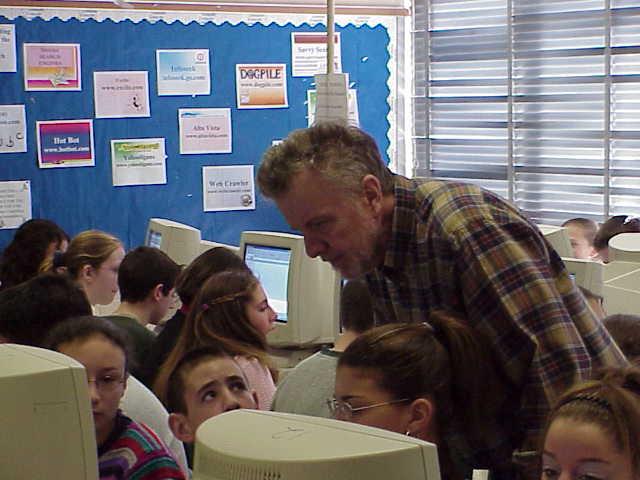
- At the same time, in science class, students retrieve satellite photos from the Internet to help students understand the earth's rotation and revolution.
- Assign a written report discussing length of day, including all its components as a cyclic change. Distribute the handout Writing the Paper.
What Students Do
Students participate in this Learning Experience in both math and science classes.
- Complete Vocabulary handout.
- Participate in the Length of Day Symposium.
- Use Spreadsheets, Spreadsheet Information, and Prepare Graphs as a team.
- Discuss team graphs, examining for symmetries and cycles, and making predictions.
- Research satellite photos from the Internet, to better understand the Earth's revolution and rotation.
- Write a report on the length of day, using the handout Writing the Paper.
Instructional/Environment Modifications
The classroom environment had to be modified in the following ways:
- Computer laboratory to allow each team to have access to a computer
- Planetarium visit might be used to facilitate understanding of celestial relationships and movement by measuring and recording changes in the daily path of the sun
- Library to accommodate large groups for a seminar
- Work in teams. Provide extra help after school for questions
The Learning Experience as it stands is geared for average and higher academic performers and, would possibly be difficult for some students. However, this does not mean that it cannot be introduced to all level students with the knowledge that modifications can be made. All students can explore and understand the concept of "length of day." The topic is rich enough to allow teachers to adapt the activity to any level of understanding for their classes. Students can create a spreadsheet and use the graphing utility to create the graphs. The ideas of symmetry, range, and patterns can be used to describe the graphs. The earth's revolution and hemispheres can also be taught on a basic level. The teacher will have a greater role in guiding their students with these ideas and helping them make the appropriate connections.
Ultimately, the teacher will decide on the appropriate depths of understanding. Versions of the project could easily be modified and reduced in scope. Students may need to stay in teams for the entire activity and instead of writing an in-depth report they could write journal entries, or present an oral report using a PowerPoint presentation, or create a book describing life in different hemispheres over time.
Duration
This Learning Experience took approximately the amount of time listed below:
- Approximately 5 hours of interdisciplinary planning (teacher to teacher)
- 80-120 minutes of computer time for students to input data and generate graphs
- 80-120 minutes of class discussion, symposium, and individual work
- 4 hours to assess written report (50 students) using the rubric
Resources
PowerPoint Presentation: Day and Night Project
Observer's Handbook: The Royal Astronomical Society of Canada, 136 Dupont Street, Toronto, Ontario M5R 1V2. ISSN 0080-4193.
- Additional Handouts and Support Materials:
Student Work


Assessment Plan
Students are assessed throughout the unit for comprehension of the concept. Since emphasis is on understanding the linkage between science and math (as well as technology), the teachers routinely discuss the progress of the students to determine how well the concepts are being grasped. Interaction with teams is essential, to provide clarification and motivation, stressing the role of the students as problem solvers.
The Rubric: Sunrise-Sunset Project is reviewed with the class during the Symposium and again when the paper is assigned.
Project Rubric
Authors
Claudine Vacirca and Robert Link, Plainedge Public Schools
Reflection
Comments from Claudine Vacirca and Robert Link:
We saw a need for students to experience the power and usefulness of using mathematics to help solve problems in the world around them. We wanted the problem to be one that would grab their curiosity and easily fit into the earth science and math curricula. We also wanted them to have content knowledge in both areas, and be able to use that knowledge in the investigation of new ideas and the extension of those ideas. What the students lacked were the developing strategies to attack this problem. This we felt we needed to model for them, particularly in the symposium.
The last component was the monitoring of the project. Ongoing self-assessment both by the students and teachers accomplished this. The symposium was created as a way to make sure all participants in this project had another chance to see first hand strategies being used to help problem solving.
The decision to have the students write a report was to reinforce the idea that they could make logical connections in written form as well as orally. It gave students a chance to reflect on all aspects of the project and to help them become risk takers.
We learned that there are problems using dates and times in different spreadsheet programs with some work we were able to overcome these problems. We also learned that we needed to model the techniques of making connections by using multivariable models. For example, using overheads to show how overlapping graphs for different latitudes emphasized a common point of intersection. But what significance did that point have? Was this symmetry to be used to make predictions? We found that our group symposium gave us the opportunity to lead our students through the thought process needed to answer these and many other questions. The role of the teacher was to coach the student, and make the abstract concrete.
Students would have a high learning curve for instructional technology if they had no background in spreadsheets. For this reason, this activity was a continuation of a series of spreadsheet explorations. In preparation for this project, the students began with a simple set of measured data resulting in a linear graph. They measured the foot size and height of 20 different people. In the second activity, they developed a more complex spreadsheet using weather data from hurricane advisories they got off the Internet. This made the students familiar with time and the spreadsheet. This project incorporated the skills learned from the previous lesson and added some new ones, such as the trend line and correlation coefficient. The project also introduced to the students the idea of writing a report based on real-world data. This report was graded using a similar rubric.

